CHAPTER 22/ 45
Quantitative Research Methodology
Core idea: Freeze the hypothesis, sample, and evaluation method before seeing the final test results, and record every attempt. Otherwise, no number called “significant” can answer whether it reflects a real pattern or noise discovered through search. Prerequisites: Chapter 3 (data timing and inventories), Chapter 7 (mean inference and bootstrap), Chapter 11 (compounding returns), Chapter 15 (regression and HAC), and Chapter 21 (portfolio construction and turnover). By the end, you will be able to write and hash a frozen research plan with ten stages; maintain a trial ledger; calculate Bonferroni, Holm, and Benjamini–Hochberg adjustments by hand; derive the expected inflation when taking the maximum of
null trials; distinguish “writing the plan first” from “mining after the fact” and explain why a local hash cannot prove which came first; and complete a holdout evaluation on real French industry data that includes a negative result.
1. Chapter Objectives
This chapter addresses a question shared by Chapters 22–28: when you claim that “this signal works,” why should anyone believe that you did not simply choose the best of twenty versions?
After completing this chapter, readers should be able to do five things:
- Put the inputs, outputs, audit trail, and typical failure for each of the ten stages—“economic hypothesis → data → cleaning → features → signal → portfolio → backtest → validation → cost model → out of sample”—in a table, and explain how each stage connects to Chapters 3, 7, 11, 15, and 21.
- Write a frozen research plan: hypothesis and sign, sample windows, a single primary metric, numerical pass/fail criteria, cost assumptions, and a trial budget; calculate its SHA-256; and explain what the hash does and does not prove.
- Maintain a trial ledger that records the specification, metric, sample size, and status of every evaluated variant, including abandoned attempts and undefined results.
- Calculate and explain
, Bonferroni, Holm, and Benjamini–Hochberg by hand; write the expected maximum of independent standard normal variables and check the approximation; and understand why correlated variants are not the same as independent trials. - Follow a complete discovery–holdout evaluation, including a result that fails its criterion on real data, and write the conclusion according to the rule set in advance.
The standard for “complete” is not a small p-value. Any reader should be able to use only your plan, ledger, code, and data hashes to recompute every reported number and see every variant you tried.
2. Why Quant Needs This
Chapters 14–21 gave you measurement tools: regression and HAC standard errors (Chapter 15), unit roots and cointegration (Chapter 17), and portfolio construction and costs (Chapter 21). Part IV begins “systematic alpha research,” where the same historical data are repeatedly used to test many signals. More tools also mean more ways to make mistakes: you can change the lookback window, winsorization threshold, number of buckets, sample start, or label horizon. Each change produces a new t-statistic.
Two facts show that this is not merely a theoretical concern. First, in the abstract of their 2014 NBER working paper, Harvey, Liu, and Zhu wrote that hundreds of papers and hundreds of factors had tried to explain the cross-section of expected stock returns. Given this extensive data mining, they argued that continuing to use the usual t-ratio threshold of 2.0 for a newly discovered factor was unjustified in that multiple-testing setting; their multiple-testing framework suggested a t-ratio above 3.0 (corresponding to a p-value of 0.27%) for new factors. They also noted that the true number of attempts includes unpublished failures, so even 3.0 may be too low. Second, Gelman and Loken (2013, unpublished manuscript) pointed out that multiple comparisons arise through “forking paths” even when a researcher performs only one analysis and holds the hypothesis in advance, if analytical details—such as which observations to exclude, which contrast to measure, or which variables to control—depend on what the data look like. They also emphasized that a selected analysis being a deterministic function of the observed data does not remove the multiple-comparison problem: a p-value asks what would happen with another possible dataset.
Together, these points determine the logic of this chapter: first define which “attempts” count; then use a frozen plan to lock in the choices that can be fixed; evaluate on a holdout sample; put adjusted significance thresholds into the decision rule; and decide what to report. This chapter does not teach a particular signal or provide conclusions for the later chapters on Value, Momentum, or Quality. It provides a process that makes those chapters’ conclusions inspectable.
3. Intuition
Imagine trying to prove that you can guess coin flips correctly. In the first approach, before flipping the coin, you write down the rule: “I will guess ten times, and I count as skilled if I get at least nine right.” Then you flip. In the second approach, you flip ten times, look at the results, then decide whether you meant to predict the first five flips or the odd-numbered ones, and find a rule that describes the sequence. Both approaches might report “nine correct,” but only the first makes that number informative.
In financial research, the “rule” corresponds to a set of choices: how many months to look back, how many to skip, whether to winsorize, how many buckets to use, which sample period to choose, and whether to exclude small-cap stocks. You may not feel that you are “fishing,” because each choice has a rationale. The problem is that if the data looked different, you could find equally good reasons for a different set of choices. That freedom to “always find a reasonable story after the fact” is what Gelman and Loken call forking paths.
State the limits of the simplification. There are 32 independent opportunities only if each attempt uses a fresh, independent batch of ten coin flips. Different post hoc subsets or rules applied to the same ten flips are not thereby independent. Financial variants are different: signals with 11-month and 12-month lookbacks are highly correlated, and their t-statistics tend to rise and fall together. The Monte Carlo experiment in this chapter will show that 32 mutually correlated variants correspond to only about 4–5 effective independent trials. Here, the “effective number” is matched to the mean of the maximum absolute statistic. It describes only one moment; it is not the size of the test family and does not guarantee the same tail probability. Bonferroni still counts the actual 32 attempts. Correlation does not let you pretend you looked only once.
3.1 From an Economic Question to a Deliverable Research Object
Start by asking, “Why might stocks with a high book-to-market ratio earn higher returns next month?” One economic explanation is that investors require compensation for distress risk; another is that prices underreact to information. Both imply a positive-direction prediction, but they call for different falsification tests and risk controls. So write the mechanism first, then a measurable statement: “Within a prespecified stock universe, financial-statement availability rule, and set of months, higher B/M corresponds to higher returns next month.” Each step below delivers a concrete object.
| Step | Operation and units in this example | Recipient of the output |
|---|---|---|
| Observable input | Same-vintage book equity and contemporaneous market capitalization that were public and ingested by the cutoff, both in the same currency | Feature calculation |
| Feature | Same-date preprocessing | |
| Signal | Percentile rank of valid B/M values on the same date, in the range 0–1; record the specification separately if comparing an industry-relative version | Prediction evaluation and weight construction |
| Prediction | The primary prediction is a positive relative ordering; to predict return magnitudes, estimate and freeze the return mapping in the discovery window | Holdout label evaluation |
| Portfolio | Buy the high bucket and sell the low bucket, with each leg’s weights summing to |
Trade/position ledger |
| Evaluation | IC by date, returns before and after costs, benchmark differences, and valid dates; decide under the frozen rule | Research conclusion and next research log |
A “high signal” is not a prediction of “an 8% return”; a percentile gives only an ordering. IC evaluates ordering or a linear relationship, while portfolio returns also depend on weights, execution timing, and costs. Chapter 23 covers prediction evaluation; Chapters 21 and 29 cover weights and the ledger. When the data have already been examined repeatedly, this process can constrain the choices made now, but it cannot erase past exposure.
4. Mathematical Foundations
This chapter uses only:
- The one-sample mean t-statistic. If
are monthly observations of a metric, the sample mean is , and the sample standard deviation is , then . The denominator is the standard error of the mean and has the same units as ; is dimensionless. The metric here is the monthly cross-sectional Information Coefficient (IC, defined in Chapter 23 and treated here simply as a dimensionless monthly correlation), and is the number of months. - Long-run variance and the Newey–West adjustment. If
is serially correlated, the variance of its mean is no longer . The Bartlett-kernel long-run variance is , where ; the estimated variance of the mean is . gives the independent and identically distributed formula (with divisor , not ). Chapter 15 used this for regression coefficients; here it applies directly to a constant-only regression. - The union bound in probability theory (Boole’s inequality): for any events
, , with no independence requirement. - Order statistics: the maximum
of independent, identically distributed variables satisfies . - The null-hypothesis property of p-values: for a valid test,
for ; equality holds for an exact p-value calibrated to the correct continuous null distribution; that p-value is uniform under the null.
Frequency convention: unless stated otherwise,
5. Formal Definitions
Research hypothesis: A falsifiable statement that names an object, direction, and horizon, such as “stocks with a high book-to-market ratio earn higher returns than stocks with a low book-to-market ratio over the next month (positive sign).” The directional economic hypotheses in this chapter require a clear object, sign, and horizon. “The value factor works” supplies no specific decision criterion and invites post hoc interpretation. This does not rule out a prespecified two-sided primary test: it need not predict the sign, but must specify the object, horizon, null hypothesis, and two-sided rejection rule in advance.
Research plan and freeze: A research plan is a file specifying the hypothesis, stock universe, data sources, discovery and holdout windows, signal definition, label definition, portfolio rule, benchmark, single primary metric, numerical pass/fail criteria, cost assumptions, and trial budget (the maximum number of variants to inspect). To freeze it, compute the SHA-256 of its normalized JSON and record the local clock time. The hash carries the previous step, “write down the plan,” into the next step, “evaluate the holdout,” as a reference that cannot be silently changed; the next definition explains its limits.
Local freeze and preregistration: Under collision-resistance and related cryptographic assumptions, a local freeze lets you compare normalized current content with a trusted saved digest. A match supports content identity with that reference; the digest itself records no writing or editing history, and the timestamp comes from your own machine. Preregistration requires a registration maintained outside the research team with an independent timestamp, such as a public registry or a file held by a third party. Only that provides external evidence that the plan preceded the data results. This chapter’s ResearchPlan and freeze_plan perform only a local freeze. Gelman and Loken also noted that preregistration of public data analyzed repeatedly by many people has “little point,” because a researcher cannot pretend to know nothing about the data. The French industry data used here fall into this category, so the conclusion in Section 11 can serve only as a process demonstration.
Trial and trial ledger: A trial is any evaluation of a variant whose results you read to judge whether a hypothesis holds. The ledger is an append-only table of trial ID, specification, metric, sample size, status (primary / run / abandoned), and notes. A repeated run of the same specification still gets a row. An attempt with an undefined result (NaN) also gets a row, because you still looked at the data. The number of ledger rows is a lower-bound input for multiple-testing adjustments.
Research log: The ledger records “what was done and what it produced”; the log records “why it was done and why it changed.” Keep them separate: the ledger is data, the log is narrative.
Discovery sample, holdout sample, and embargo: Use the discovery sample to choose specifications; evaluate on the holdout only once, after the specification is fixed. If a label spans
Benchmark: A reference that answers, “What would happen without this signal?” This chapter uses three kinds: a no-signal benchmark (equal-weight holdings), a permutation placebo (randomly shuffle asset labels within each month, preserving that month’s label set and the time order), and a simple published rule (for example, fixed 12-1 momentum).
Ablation: With all other steps fixed, remove one component at a time (winsorization, rank transform, lag, and so on) and observe how the result changes to identify the role of each component. Ablations are trials and must be entered in the ledger.
Negative result and reproducibility: A negative result is one that does not support the hypothesis under the prespecified criterion; report it as fully as a positive result. Reproducibility means that anyone with the code, data hashes, random seeds, and ledger obtains the same numbers.
Family-wise error rate and false discovery rate (FWER and FDR): Among
Ten-stage research pipeline: The table below is the main structure of this chapter. Every stage has inputs, outputs, an audit trail, and a typical failure. Read it from left to right: the output of one stage becomes the input to the next. The plan is frozen at Stage 1, the cost model is at Stage 9, and holdout evaluation is at Stage 10.
| Stage | Input | Output and audit trail | Typical failure | Related chapters |
|---|---|---|---|---|
| 1 Economic hypothesis | Mechanism, literature, your prior | One sentence with sign, object, and horizon; plan file and hash | No sign; can be interpreted arbitrarily after the fact | 22 |
| 2 Data | Source, authorization, version | Source URL, download time, SHA-256, available_at |
Passing a current revision off as historically available data | 3, 13 |
| 3 Cleaning | Raw table | Written rules for missing values and outliers; cleaning log | Deciding whom to exclude after seeing returns | 3 |
| 4 Features | Cleaned data | Feature definition with window, units, and availability time | Using data that arrive after signal_time |
11, 12 |
| 5 Signal | Features | Signal transformed cross-sectionally on the same date | Full-sample standardization; using a future mean today | 23, 28 |
| 6 Portfolio | Signal | Target weights, constraints, turnover | Mixing constraints into the signal definition | 21, 23 |
| 7 Backtest | Weights, returns | Label interval, lags, gross returns, and ledger | Not counting repeated iterations on the same data | 22, 29, 30 |
| 8 Validation | Backtest results | Holdout evaluation, benchmarks, ablations, permutations | Tuning on the holdout sample | 22, 31 |
| 9 Cost model | Turnover, fee rates | Gross/net returns; capacity assumptions | Applying fees to the wrong weight changes | 21, 35 |
| 10 Out of sample | Frozen specification | One-time evaluation; report negative results too | Changing the hypothesis after seeing results and calling it “out of sample” | 22, 31 |
Time fields run through all stages: when an event occurs (event_time); when the system can access it (available_at); when it is ingested locally (ingested_at); the decision time (signal_time); execution time (trade_time); and the return and label intervals. An executable study requires both available_at and ingested_at to be no later than the decision cutoff, and signal_time < trade_time; measure returns from the actual execution price. This chapter’s month-end label treats a hypothetical month-end trade as a research proxy. A later label month does not mean that all returns occurred after a real trade. See the fields and clocks in Section 5.2 of Chapter 23.
5.1 A Small Ledger: How a Primary Hypothesis, Exploration, and Holdout Coexist
The five rows below are a constructed teaching example, not a historical market result from this chapter. The plan first specifies the primary B/M specification and positive direction, discovery window
| ID | Specification and status | Results read from | p-value | Conclusion status |
|---|---|---|---|---|
| D01 | Primary specification, same-date percentile rank | 0.01 | Primary-hypothesis discovery result | |
| D02 | Changed to industry-relative ranks after seeing D01 | 0.04 | Post hoc exploration | |
| D03 | Changed the winsorization threshold after seeing results | 0.03 | Post hoc exploration | |
| D04 | Constant signal; IC undefined | Missing | Undefined attempt; retain reason and sample size | |
| D05 | Best result after changing label horizon | 0.005 | Post hoc exploration; cannot be relabeled as the primary specification |
These five attempts serve the same discovery decision and, under this chapter’s all-attempts convention, form one test family,
Record the holdout evaluation separately as H01 and link it to the question “does it evaluate D01 or D05, selected in the discovery window?” If the plan registers only D01 as the primary confirmatory test, report the holdout result for D05 as post-exploration validation. If the plan prespecifies the complete algorithm of selecting a specification in the discovery window and confirming it on the holdout, H01 evaluates the specification chosen by that algorithm. Fix either plan before opening
The local hash binds the plan’s contents; a third party’s record supports the freeze time; the fact that the French history was used before records prior exposure. These answer different questions—“what was the content?”, “when was it written?”, and “what historical data were already known?”—and cannot replace one another. Separating the discovery and holdout windows reduces label overlap, but does not guarantee statistical independence in financial time series; inference still requires checking dependence and sample size.
6. Derivations
6.1 Family-Wise Error Rate Under Multiple Testing
Suppose there are
The derivation uses only independence: the probability of no rejection is
Interpretation: with 32 independent attempts, the probability of at least one “significant” result is 81%, which is why the plan needs a “trial budget.” This assumes the tests are independent. Dependence does not guarantee that the probability is below 81%; the specific constructed experiment in Section 13 measured 23.6%, which cannot be generalized as a bound for arbitrary dependence structures.
6.2 Bonferroni Correction and the Union Bound
No independence is required. Let
The first step is the union bound, the second uses
6.3 Why Holm’s Step-Down Procedure Also Controls FWER
Sort
Let
Comparison: Holm and Bonferroni use the same threshold at Step 1 (
6.4 Benjamini–Hochberg and the False Discovery Rate
The BH procedure finds the largest
6.5 How Large Is the Maximum of
Let
For
Bailey and López de Prado (2014, Eq. (1), Appendix A.1) give this large-
where
| Approximation | Numerical integration | Relative error | |
|---|---|---|---|
| 2 | 0.520 | 0.564 | −7.9% |
| 5 | 1.193 | 1.163 | +2.5% |
| 10 | 1.575 | 1.539 | +2.3% |
| 32 | 2.100 | 2.070 | +1.5% |
| 100 | 2.531 | 2.508 | +0.9% |
| 1000 | 3.255 | 3.241 | +0.4% |
The approximation is inaccurate for small
6.6 Why Evaluation After Selection Requires New Data
Suppose you select the variant with the largest
6.7 From
If monthly long-short returns
7. Financial Interpretation
A hypothesis needs an economic mechanism first. A hypothesis suitable for a plan should fit at least one of three mechanisms: risk compensation (the feature represents risk exposure for which investors demand a higher return), behavioral underreaction to information (prices adjust slowly to public information), or institutional or financing constraints (some investors are forced to buy or sell). Chapters 24–27 give the mechanisms and counterarguments for Value, Momentum, Quality, and Carry. A mechanism does not prove that a signal works; it limits which variants you can legitimately try. If the mechanism says “winners over the past year continue to win,” you should not change it to “winners over the past seven weeks” because the data look better.
The threshold changes with the number of attempts. HLZ’s (2014) recommendation of
A holdout sample has limited meaning. A holdout separates “selection” from “evaluation,” but it is not a new world: it comes from the same market, the same data provider, and usually the same proxy. A signal that passes on the holdout may still have very low capacity, negative returns after costs, or fail in the next regime. A method controls FWER or FDR when the marginal p-values are valid and the specified selection and dependence conditions hold; an individual study can still report a false positive. Error-rate control also does not prove that returns are positive after costs.
Negative results carry information. If you write in advance that “holdout
8. Numerical Example: Work Through Every Step
Every number in this section can be checked by hand; the code in Section 9 checks it again with assertions.
8.1 A Five-Trial Ledger and Three Adjustments
8.2 Another Example with Four p-Values
8.3 Hash of the Frozen Plan
The code in Section 9 writes a value-hypothesis plan as a ResearchPlan. With the local clock fixed to 2026-10-06 09:00 UTC, it produces a SHA-256 whose first 16 characters are 40d38a74d67e0c08. If only the criterion changes from “holdout e8ba36254e34603b…, completely different. If a colleague has already retained a trusted copy of the original digest, a digest comparison will identify modified content, under the collision-resistance assumption. Keeping a file and digest that can both be replaced does not establish a tamper-evident history. A hash also cannot prove that the data had not been seen before the plan was written.
8.4 Family-Wise Error and the Bonferroni Threshold for 32 Variants
For 32 independent tests at a 5% level,
9. Python Implementation
Reusable code for this chapter is in research_protocol.py; cross-sectional and IC tools are in factor_research.py (covered in Chapter 23); and monthly momentum windows are in factor_signals.py. Interfaces:
| Function/class | Input | Output and limits |
|---|---|---|
ResearchPlan |
Hypothesis, stock universe, data sources, four window endpoints, signal/label/portfolio definitions, benchmark, primary metric, criteria, cost assumptions, trial budget | Frozen data class; raises an error if any required field is empty, the budget is not a positive integer, or the discovery and holdout windows overlap |
freeze_plan |
Plan and optional local clock | FrozenPlan, with SHA-256 of normalized JSON and a local time string; not an external timestamp |
TrialLedger.record |
Specification dictionary, metric, sample size, status, notes | Appends a row; metric must be a finite real number or NaN; rejects infinity, Boolean values, and unknown statuses; n_trials counts every row |
bonferroni_adjust, holm_adjust, benjamini_hochberg_adjust |
One-dimensional p-value array | Returns adjusted p-values in input order; rejects empty arrays, out-of-range values, and NaN |
expected_max_standard_normal, ..._exact |
Integer |
DSR approximation ( |
split_discovery_holdout |
Monthly PeriodIndex and plan |
Two disjoint sets of month labels; raises an error when windows and sample have no overlap |
The first code sample freezes a value-hypothesis plan and demonstrates hashing:
import dataclasses
from datetime import datetime, timezone

from quant_course.research_protocol import ResearchPlan, freeze_plan

plan = ResearchPlan(
    hypothesis="Cheap stocks (high B/M) earn higher next-month returns (sign +)",
    universe="constructed 200 names x 180 months",
    data_sources=("constructed panel, seed 20261006",),
    discovery_start="2000-01", discovery_end="2009-12",
    holdout_start="2010-01", holdout_end="2014-12",
    signal_definition="percentile rank of B/M within month, no lag",
    label_definition="next-month simple return",
    portfolio_rule="top quintile minus bottom quintile, equal weight",
    benchmark="equal-weight universe",
    primary_metric="t of mean IC: Pearson correlation of within-month signal ranks with next-month return, Newey-West lag 0, holdout",
    decision_rule="holdout t >= 2.0 and positive sign",
    cost_assumption="10 bp per unit traded", trial_budget=1,
)
clock = datetime(2026, 10, 6, 9, 0, tzinfo=timezone.utc)
frozen = freeze_plan(plan, now=clock)
edited = freeze_plan(dataclasses.replace(plan, decision_rule="holdout t >= 1.5 and positive sign"), now=clock)
assert frozen.sha256.startswith("40d38a74d67e0c08")
assert edited.sha256.startswith("e8ba36254e34603b") and edited.sha256 != frozen.sha256
print(frozen.sha256[:16], edited.sha256[:16])
The second code sample repeats the five trials in Section 8.1: it counts the ledger, applies three adjustments, and checks them against the hand calculations:
import numpy as np
from scipy import stats

from quant_course.research_protocol import (
    TrialLedger, benjamini_hochberg_adjust, bonferroni_adjust, holm_adjust, pad_untested_attempts,
)

t = np.array([2.4, 1.1, 0.4, 1.9, 2.1])
ledger = TrialLedger()
for name, value in zip("abcde", t):
    ledger.record({"variant": name}, metric=float(value), n_obs=120, status="primary" if name == "a" else "run")
ledger.record({"variant": "f"}, metric=float("nan"), n_obs=0, status="abandoned", note="constant signal: IC undefined")
assert ledger.n_trials == 6          # the undefined attempt still counts as a look at the data

p = 2 * stats.norm.sf(t)
np.testing.assert_allclose(np.round(p, 4), [0.0164, 0.2713, 0.6892, 0.0574, 0.0357])
np.testing.assert_allclose(np.round(bonferroni_adjust(p), 3), [0.082, 1.0, 1.0, 0.287, 0.179], atol=1e-3)
np.testing.assert_allclose(np.round(holm_adjust(p), 3), [0.082, 0.543, 0.689, 0.172, 0.143], atol=1e-3)
np.testing.assert_allclose(np.round(benjamini_hochberg_adjust(p), 3), [0.082, 0.339, 0.689, 0.096, 0.089], atol=1e-3)
full = pad_untested_attempts(p, ledger.n_trials)            # the undefined attempt enters the family as p = 1: family size 6
np.testing.assert_allclose(np.round(bonferroni_adjust(full)[:5], 3), [0.098, 1.0, 1.0, 0.345, 0.214], atol=1e-3)
np.testing.assert_allclose(np.round(holm_adjust(full)[:5], 3), [0.098, 0.814, 1.0, 0.230, 0.179], atol=1e-3)
np.testing.assert_allclose(np.round(benjamini_hochberg_adjust(full)[:5], 3), [0.098, 0.407, 0.827, 0.115, 0.107], atol=1e-3)
print(ledger.to_frame()[["trial_id", "status", "metric"]])
Note that ledger.n_trials is 6, not 5: the sixth result is undefined, but you read the data to obtain it. The primary result should use the full-ledger family size pad_untested_attempts to add attempts with no p-value to the family as
The third code sample checks the accuracy of the expected-maximum approximation (the table in Section 6.5):
import numpy as np

from quant_course.research_protocol import expected_max_standard_normal, expected_max_standard_normal_exact

exact_two = expected_max_standard_normal_exact(2)
assert abs(exact_two - 1 / np.sqrt(np.pi)) < 1e-9                 # hand value 1/sqrt(pi) = 0.5642
for n, tol in ((10, 0.04), (100, 0.03), (1000, 0.02)):
    approx, exact = expected_max_standard_normal(n), expected_max_standard_normal_exact(n)
    assert abs(approx - exact) < tol
print(round(expected_max_standard_normal(32), 3), round(expected_max_standard_normal_exact(32), 3))   # 2.1 2.07
Default offline entrypoint and historical experiment are separate. From the root of the accompanying I3 reader package, run:
.venv/bin/python run_notebook.py notebooks/ch22_research_methodology.ipynb
The default is RUN_FRENCH=False. The notebook demonstrates freezing and hashing, a six-row ledger and the two family-size conventions for five valid p-values, the expected maximum, one single 32-variant constructed world, and simulations with 60 null worlds and 60 alternative worlds (not the 500 each used for the historical charts in Sections 10 and 13). The notebook creates only a chapter-level RUN_DIR; it does not write CSV/PNG files or generate the historical chart library. The runner separately creates runs/execution_ch22_research_methodology_<uuid>/ to save an execution copy and status; do not conflate this with the chapter-level directory. The default demonstration with five valid p-values does not imply that there is a sixth valid p-value; interpret the family adjustment for the failed attempt using the earlier convention of padding with 1.
The full historical CLI is code/ch22_research_methodology.py. It includes the French branch and 500 simulations per world; it is not the default offline command. Its historical seeds are fixed at 20261006 (null world) and 20261007 (alternative world), and the local freeze plan is written before the holdout numbers are calculated; the local clock provides no external evidence of ordering. The historical numbers and charts below come from the original experiment; readers do not need to rerun it.
NaN policy: the ledger accepts NaN metrics and counts them; ic_summary drops NaN dates and records them in n_missing; after dropping, the Newey–West lags are computed by position in the valid array, so internal date gaps require separate checks. Summary calculation raises an error if fewer than three valid dates remain.
The data frequency is monthly; signal_time is month-end, the label is the following month’s simple return, and the return measurement interval is that following month. French industry monthly returns come from a revised historical snapshot, not a point-in-time vintage, so available_at is in practice later than month-end. Treating month-end as the signal time is an idealized assumption in this chapter.
10. Reading the Figures
Figure 22-1: The ten-stage research pipeline. Two rows of five boxes, read left to right and then top to bottom, with each box showing a stage name and its audit trail. There is no arrow from Stage 10 back to Stage 1: holdout results must not rewrite the hypothesis they were intended to test. This is a process diagram with no data.
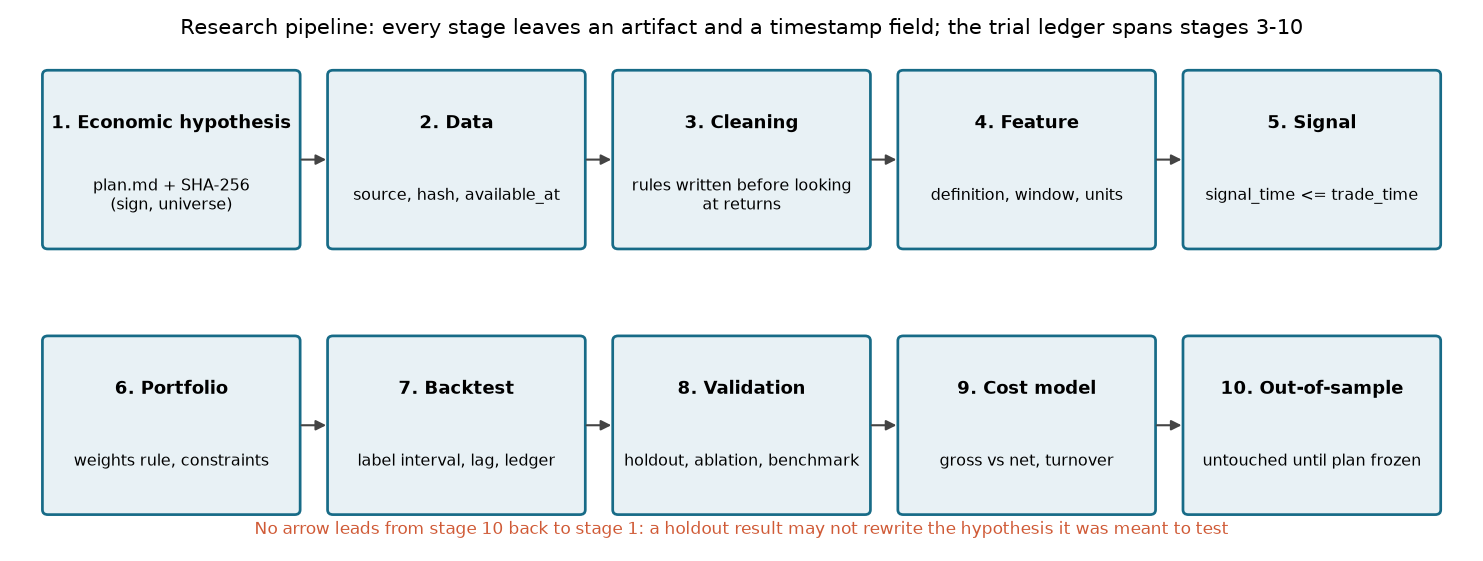
Figure 22-2: How search creates significance in a constructed world, and how a holdout distinguishes two worlds. Each of two worlds has 500 independent simulations, each with 200 stocks, a 120-month discovery sample, a 3-month embargo, and a 60-month holdout; the null-world seed is 20261006 and the alternative-world seed is 20261007 (the original chart’s shared title lists only 20261006, which must not be used to conflate the seeds). The left panel shows the null world (true IC is zero): blue is
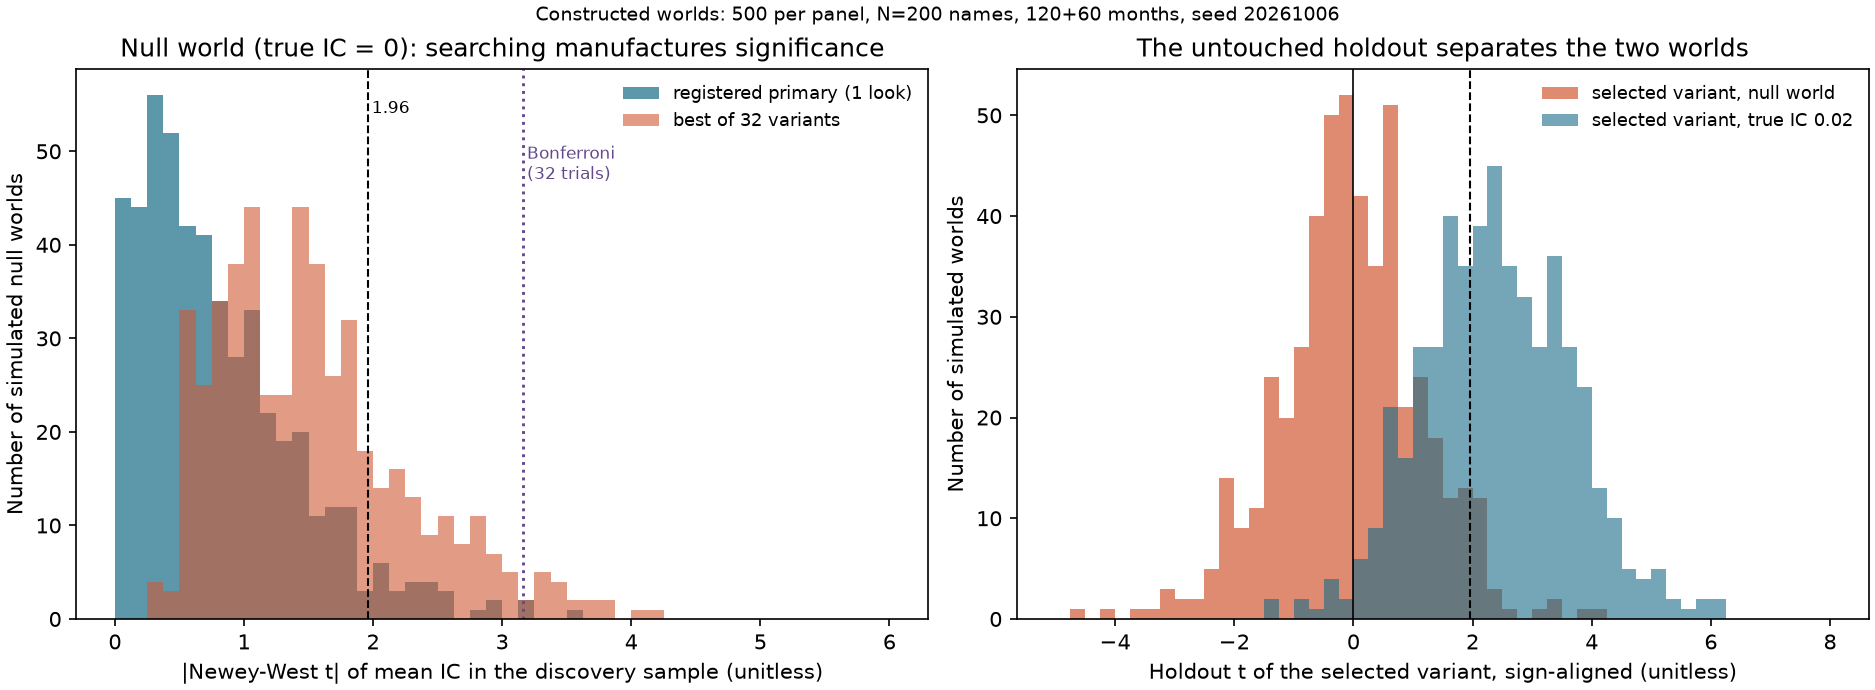
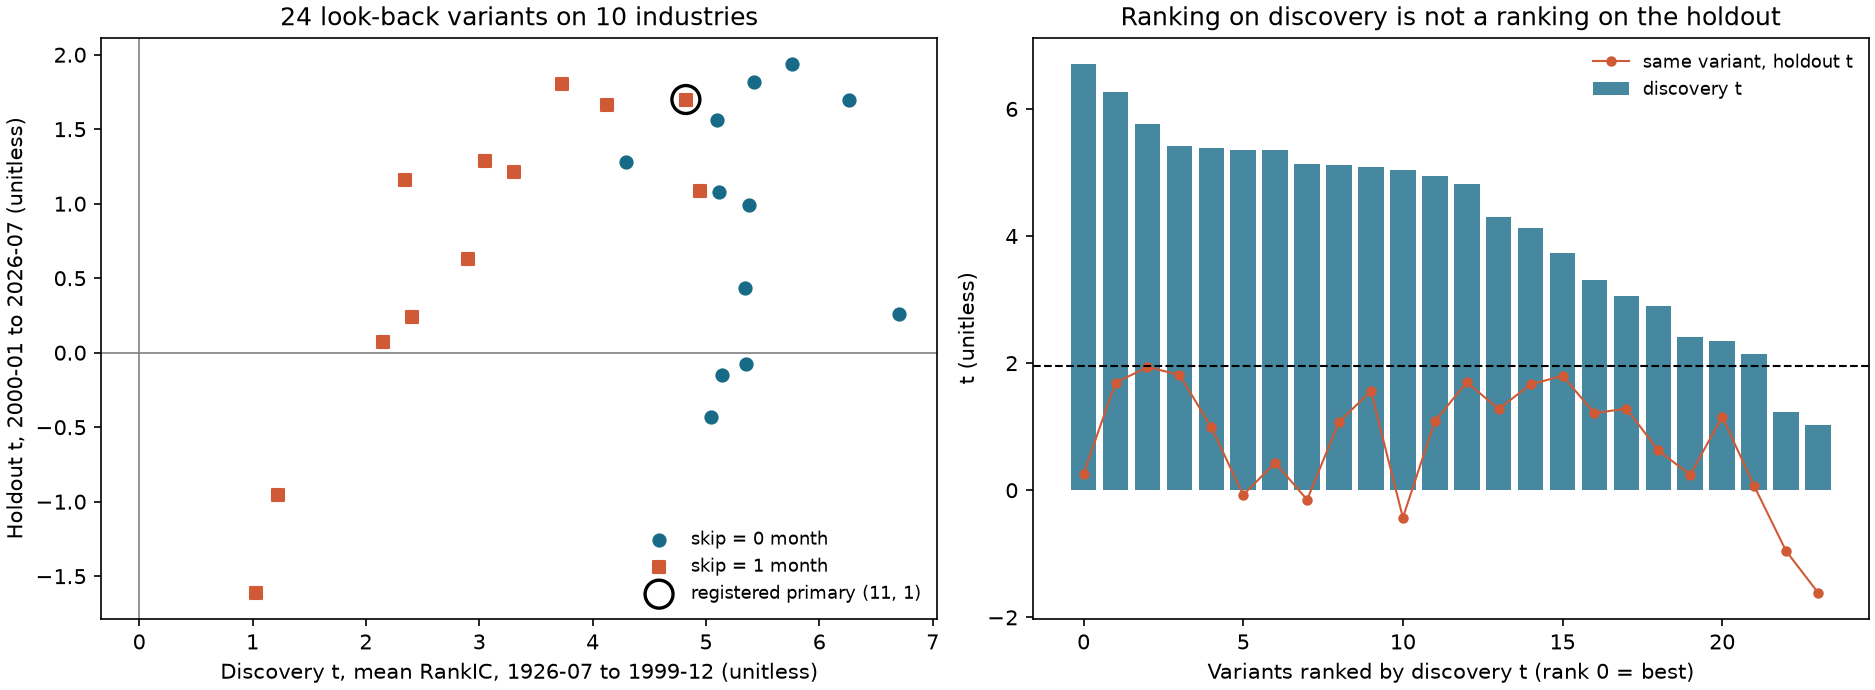
Figure 22-3: Twenty-four lookback-window variants for French industry momentum. In the left panel each point is a (lookback months, skip months) pair. The x-axis is the discovery-sample
11. Historical Market Example
Data. Use the French 10-industry value-weighted monthly returns frozen on 2026-10-05: source Ken French Data Library, 10 Industry Portfolios, ZIP SHA-256 ebd937a4b995d821867aeb956a96f09a666386f38fa82516b7d1767ee4a49ae5, processed CSV SHA-256 3b097d810c295d64eedfa1ece7067ff2a0707f5ca90e33935df9949251f70950, 1,202 months (1926-07 to 2026-08), in decimal monthly simple returns. Publicly downloadable does not mean freely redistributable. This chapter does not download new data.
Plan (frozen). Hypothesis: industries with higher past 12-1 returns have higher returns next month (positive sign). Signal: at month-end
Results. All numbers were produced by code/ch22_research_methodology.py and independently recomputed by qa/a5/claude/recompute/ch22_recompute.py (without importing course code, using a monthly loop and scipy.stats.spearmanr); the two agree.
| Variant (lookback, skip) | Discovery months | Discovery mean Rank IC | Discovery |
Holdout months | Holdout mean Rank IC | Holdout |
|---|---|---|---|---|---|---|
| Registered primary specification (11, 1) | 871 | 0.0688 | 4.82 | 319 | 0.0414 | 1.70 |
| Discovery-sample winner (1, 0) | 882 | 0.0925 | 6.70 | 319 | 0.0061 | 0.26 |
| (12, 0) | 871 | 0.0877 | 6.26 | 319 | 0.0412 | 1.69 |
| (6, 1) | 876 | 0.0433 | 3.05 | 319 | 0.0304 | 1.28 |
Of the 24 variants, 22 have discovery-sample
Apply the prespecified criterion. The primary specification’s holdout
Multiple-testing adjustment. For the two-sided p-values of the 24 discovery-sample variants, the winner’s raw p-value is about
Switch to a long-short portfolio and costs (demonstration). Each month, sort the 10 industries into five groups of two, go long the top group and short the bottom group, equal-weight each leg, for gross exposure of 2 and net exposure of 0. Turnover is the sum of absolute changes in target weights between adjacent months (buys and sells combined, not halved, ignoring drift). For the primary specification (11,1), the discovery-sample gross mean is 0.561% per month (
What this example does and does not show. It demonstrates that the registered primary specification, the discovery-sample winner, and the holdout sample can lead to very different conclusions; “not supported under the criterion” is not the same as “the estimate is significantly zero.” It does not prove that industry momentum does not exist, validate any conclusion in Chapter 25, or provide an independent test of 12-1 momentum: the holdout is not pristine, the author has read the momentum literature and used these data in earlier chapters, the cross-section has only 10 assets, and the data are revised historical values.
12. Common Errors
Error 1: Report only the best of
import numpy as np

rng = np.random.default_rng(7)
z = rng.standard_normal((20000, 20))                       # 20 independent null z-statistics per "paper"
reported_best = (np.abs(z).max(axis=1) > 1.96).mean()      # report only the best of 20
single = (np.abs(z[:, 0]) > 1.96).mean()                   # report the one pre-committed test
bonferroni = (np.abs(z).max(axis=1) > 3.0).mean()          # hurdle for 20 looks: z = 3.02 two-sided at 5%
assert abs(reported_best - (1 - 0.95**20)) < 0.015 and abs(single - 0.05) < 0.01 and bonferroni < 0.06
print(round(reported_best, 3), round(single, 3), round(bonferroni, 3))
Fix: report all variants or register one variant and state the budget in the plan. If search is unavoidable, use a Bonferroni or Holm threshold.
Error 2: Change the criterion after seeing results. The hash in Section 8.3 shows that changing one character in the criterion changes the entire hash. Fix: put the criterion in the plan and hash it; if a change is necessary, create a new version and record in the ledger and log that it was “changed after seeing the holdout result.”
Error 3: Repeatedly select using the holdout. If you evaluate 10 independent variants on the holdout and choose the best, the null-world probability of at least one “significant” result is
Error 4: Use future data in standardization or winsorization parameters. Full-sample standardization of a time series makes early signals depend on later data.
import numpy as np

x = np.array([0.5, -0.2, 0.1, 0.4, -0.1, 3.0])        # pretend x[5] arrives later
full = (x - x.mean()) / x.std(ddof=0)                  # full-sample: uses the future
causal = np.array([(x[: i + 1] - x[: i + 1].mean())[-1] / (x[: i + 1].std(ddof=0) or 1.0) for i in range(len(x))])
x2 = x.copy(); x2[5] = -3.0                            # the future value changes ...
full2 = (x2 - x2.mean()) / x2.std(ddof=0)
causal2 = np.array([(x2[: i + 1] - x2[: i + 1].mean())[-1] / (x2[: i + 1].std(ddof=0) or 1.0) for i in range(len(x2))])
assert not np.allclose(full[:5], full2[:5])            # ... and rewrites earlier "signals"
assert np.allclose(causal[:5], causal2[:5])            # expanding-window version does not
print(np.round(full[0], 3), np.round(full2[0], 3))
Cross-sectional standardization across all stocks on the same day is not this error, because all the same-date data are available before signal_time; Chapter 28 distinguishes the two cases.
Error 5: Count only “successful” trials. The ledger must include abandoned and undefined attempts (n_trials is 6 in the second code sample in Section 9). Counting only successes is equivalent to reducing
Error 6: Naive
Error 7: Selection favors the statistic with the most biased standard error. In the same null world, the selected “best variant” has a 4.6% rate of holdout
13. Quant Research Application: Compare an A Priori Fixed Plan with Post Hoc Mining for the Same Value Hypothesis
This section compares the value-hypothesis plan from Section 8.3 with a “mining version” on the same constructed data. The data are for teaching: 200 stocks, a 120-month discovery sample, a 3-month embargo, and a 60-month holdout. The feature is heavy-tailed monthly data (Student-
Path A (a priori fixed specification): evaluate only variant 0 in the frozen plan (rank transform, lag 0, one-month label), and decide under the criterion. In the simulation, each month’s statistic is the “Pearson correlation between the rank-transformed signal and raw returns” (for vectorization, returns are not ranked), so it differs from Chapter 23’s Rank IC, which ranks both sides. Other variants use “the Pearson correlation between the transformed signal and raw returns,” consistent with the plan’s primary-metric wording. The real-data analysis in Section 11 uses Spearman Rank IC, ranking both sides. Path B (post hoc mining): evaluate 32 variants (rank/raw value/1% winsorization/5% winsorization × signal lags of 0–3 months × label horizons of 1 or 3 months), select the one with the largest discovery-sample
| Metric (500 simulations) | Null world: Path A | Null world: Path B | Alternative world: Path A | Alternative world: Path B |
|---|---|---|---|---|
| Share with discovery-sample |
5.4% | 23.6% | 82.6% | 93.6% |
| Share with discovery-sample |
— | 3.6% | — | 65.8% |
| Share with holdout |
2.8% | 4.6% | 57.6% | 61.8% |
| Share of cases in which Path B selects the registered variant 0 | — | 5.8% | — | 5.0% |
Interpretation. In the null world, Path B raises the false-positive rate from 5.4% to 23.6%, not to
Implication for Project 4: before a multifactor project starts, write a frozen plan containing at least the twelve items in Section 5, and specify the ledger format, embargo rule, and one-time holdout evaluation. Without this plan, no “significant” result from Project 4 can go into the conclusion. Chapter 28 will make preprocessing, combination, and constraints separate steps in the plan. The same applies to the pair screening in Project 5: the ledger must record how many cointegration tests were run during training (see the preparation layer at projects/project05/preparation/).
Benchmark and falsification condition: use equal-weight holdings (no signal) and a permutation benchmark; write before running that “the hypothesis is not supported if holdout
14. Chapter Summary
This chapter divides a factor study into ten stages, each leaving an inspectable record. Four relationships matter. First, a frozen plan constrains choices that can be fixed before seeing results, while the ledger records every attempt whose result was read. Second, independent and well-calibrated tests give
Limits: a local hash is not preregistration; the French industry data are revised historical data and have been used in earlier chapters; a cross-section of 10 assets has low testing power; costs are assumed values; and the chapter is a methodological demonstration, not an empirical verdict on any factor.
15. Exercises
22-E01 (Conceptual) What can a local freeze and an external preregistration each prove, and what can neither prove? If a colleague asks, “Does your hash timestamp predate the data?”, how should you answer?
22-E02 (Conceptual) Give an example of financial research with one regression and a hypothesis held in advance that still has forking paths. Identify the decision points.
22-E03 (By hand) For 20 independent tests at level
22-E04 (By hand) Let
22-E05 (Derivation) Use
22-E06 (Interpretation) In the null world, 32 variants have a mean maximum
22-E07 (By hand) On a holdout sample, you evaluate 10 mutually independent null variants and report the best one. What is the probability that at least one has
22-E08 (By hand) A long-short strategy has
22-R01 (Ledger diagnosis, further practice) For the five-row ledger in Section 5.1, give the raw p-value vector used for the family, the Holm sorting multipliers, and the IDs rejected by each method at 5%. If you change the label horizon to the best value after H01, can that evaluation still be called an unexposed holdout? Could a file hash change the answer?
16. Programming Exercises
22-P01 Write your own ResearchPlan for any hypothesis, freeze it, and save it as JSON. Then change one field and verify that the hash differs; assert that overlapping discovery and holdout windows raise an error. Acceptance: all three assertions pass.
22-P02 Use a ledger to record eight variants, including one undefined result. Calculate two-sided p-values, use pad_untested_attempts to bring the full-ledger family size to n_trials==8, family size is 8, and Bonferroni
22-P03 Simulate 32 null
17. Challenge Problems
22-C01 (Proof) Prove
22-C02 (Open-ended) Write a complete frozen plan for 12-1 momentum in Chapter 25: fill in all twelve items, specify ledger fields and embargo rules, describe the one-time holdout process, and list at least three concrete numerical outcomes that would lead you to conclude that the hypothesis is “not supported.” Grading: plan completeness 30 points, falsifiability of criteria 30 points, limitations for data repeatedly analyzed by others 20 points, cost and benchmark design 20 points.
18. Complete Solutions and Reference Implementations
22-E01 A local freeze binds normalized JSON to a digest. Under collision-resistance and related cryptographic assumptions, matching a trusted saved digest supports identity with the reference content. It does not prove that the file was never changed and later restored, or establish when it was written. A file and digest that can both be replaced do not establish their own trustworthy history. The local clock can be altered and cannot show that the plan preceded exposure. An external registry holds content or a digest with a third-party timestamp, providing evidence of registration chronology; prior data exposure must still be logged. Answer the colleague: “The current content can be compared with a trusted saved digest. The local time is not external evidence of chronology. These data were used before, so this is a process demonstration.”
22-E02 Example: study whether returns over the past 12 months predict returns next month. You hold the hypothesis in advance and run only one regression, but before seeing the results you did not fix whether to remove low-priced stocks, use value weights, exclude financial stocks, or choose the sample start. If the effect appears mainly among small-cap stocks, you can find a reasonable rationale for “exclude microcaps”; if it appears among large-cap stocks, you can find a rationale for “use value weights.” Regardless of how many regressions you actually ran, these data-dependent choices are forking paths.
22-E03
22-E04
22-E05 Both expected_max_standard_normal(2).)
22-E06 Here
22-E07
22-E08
22-R01 The family’s raw p-value vector is
22-P01 Reference Implementation
import dataclasses
import json
from datetime import datetime, timezone

import pytest

from quant_course.research_protocol import ResearchPlan, freeze_plan

plan = ResearchPlan(
    hypothesis="Higher past 12-1 return predicts higher next-month return (sign +)",
    universe="10 French industries", data_sources=("french_10_industries_monthly.csv",),
    discovery_start="1926-07", discovery_end="1999-12", holdout_start="2000-01", holdout_end="2026-07",
    signal_definition="12-1 compounded return", label_definition="next-month simple return",
    portfolio_rule="top 2 minus bottom 2, equal weight", benchmark="equal-weight 10 industries",
    primary_metric="t of mean RankIC in holdout", decision_rule="holdout t >= 2.0 and positive",
    cost_assumption="10 bp per unit traded", trial_budget=24,
)
clock = datetime(2026, 10, 6, 9, 0, tzinfo=timezone.utc)
first = freeze_plan(plan, now=clock)
second = freeze_plan(dataclasses.replace(plan, trial_budget=25), now=clock)
assert first.sha256 != second.sha256
saved = json.dumps({"sha256": first.sha256, "frozen_at_local": first.frozen_at_local}, indent=1)
assert json.loads(saved)["sha256"] == first.sha256
with pytest.raises(ValueError):
    dataclasses.replace(plan, holdout_start="1999-06")        # overlaps the discovery window
22-P02 Reference Implementation
import numpy as np
import pandas as pd
from scipy import stats

from quant_course.research_protocol import (
    TrialLedger, benjamini_hochberg_adjust, bonferroni_adjust, holm_adjust, pad_untested_attempts,
)

t_values = [2.8, 2.1, 1.7, 1.2, 0.9, 0.5, -0.4]
ledger = TrialLedger()
for i, value in enumerate(t_values):
    ledger.record({"variant": i}, metric=value, n_obs=120, status="primary" if i == 0 else "run")
ledger.record({"variant": 7}, metric=float("nan"), n_obs=0, status="abandoned", note="constant signal")
assert ledger.n_trials == 8
p = np.append(2 * stats.norm.sf(np.abs(np.array(t_values))), np.nan)          # the undefined attempt has no p-value
family = pad_untested_attempts(p[:-1], ledger.n_trials)                          # ... and enters the family as p = 1: M = 8
assert family.size == 8 and family[-1] == 1.0
table = pd.DataFrame({"t": t_values + [np.nan], "p": family, "bonf": bonferroni_adjust(family), "holm": holm_adjust(family),
                      "bh": benjamini_hochberg_adjust(family)})
assert (table["bonf"] >= table["holm"] - 1e-12).all() and (table["holm"] >= table["bh"] - 1e-12).all()
assert (table["bonf"].iloc[-1], table["holm"].iloc[-1], table["bh"].iloc[-1]) == (1.0, 1.0, 1.0)
print(table.round(4))
(The seven t-values plus one undefined attempt make eight ledger rows. Add the undefined attempt to the family as
22-P03 Reference Implementation
import numpy as np
from scipy import integrate, optimize, stats


def mean_max_abs_normal(n):
    cdf = lambda x: 2 * stats.norm.cdf(x) - 1
    pdf = lambda x: 2 * stats.norm.pdf(x)
    return integrate.quad(lambda x: x * n * pdf(x) * cdf(x) ** (n - 1), 0, 12, limit=200)[0]


rng = np.random.default_rng(1)
m, rho, worlds = 32, 0.8, 20000
common = rng.standard_normal((worlds, 1))
z = np.sqrt(rho) * common + np.sqrt(1 - rho) * rng.standard_normal((worlds, m))
observed = np.abs(z).max(axis=1).mean()
n_eff = optimize.brentq(lambda n: mean_max_abs_normal(n) - observed, 1.0, 500.0)
assert 1.55 < observed < 1.75 and 5.0 < n_eff < 7.0
assert abs(mean_max_abs_normal(32) - 2.347) < 0.01
print(round(observed, 3), round(n_eff, 2), round((np.abs(z).max(axis=1) > 1.96).mean(), 3))
The output is approximately 1.648, 5.92, and 0.258: the maximum absolute value of 32 variants with correlation 0.8 matches about six independent trials on this one moment. Under the null, taking the maximum leads to rejection at 1.96 in 26% of cases, far below the 81% for independent tests.
22-C01 Let
22-C02 (Scoring Guide and Reference) A sample plan: hypothesis: “the higher the compounded return over the past 12-1 months, the higher the return next month (positive sign)”; state whether the stock universe includes small caps and financials; specify total-return price data and available_at; give discovery and holdout endpoints; signal: 12-1 (11-month window, skip 1 month); label: next month; portfolio: equal-weight decile long-short, rebalanced monthly; benchmarks: equal-weight and permutation; primary metric: holdout Rank IC
19. Further Reading
- Must know: Harvey–Liu–Zhu working paper Sections 4.3–4.4 (definitions and examples of FWER, FDR, Bonferroni, and Holm); read the abstract and introduction first, then these sections. Purpose: understand why
is no longer enough. - Must know: Gelman–Loken, Sections 1.1–1.2 and 4.3, on forking paths and the limits of preregistration.
- Should know: the first half of Bailey–López de Prado’s Deflated Sharpe Ratio, Eq. (1) and Appendix A.1; read the full construction again in Chapter 32.
- Should know: the definition in Section 2 of Bailey et al.’s PBO paper, on overfitting in the selection process; used in Chapters 30–32.
- Advanced: the original papers by Holm (1979), Benjamini–Hochberg (1995), and Benjamini–Yekutieli (2001), to check the conclusions in Sections 6.3 and 6.4; these originals have not been read for this chapter.
- Optional: instructions from any public preregistration platform to learn how external timestamps work.
20. References
Citation keys and reading ranges are listed in source_notes.md.
- CH22_HLZ2014: Harvey, C. R., Liu, Y., Zhu, H. (2014). “… and the Cross-Section of Expected Returns.” NBER Working Paper 20592. Supports Sections 2, 5, 6.3, and 7; the 2016 RFS journal version has not been read.
- CH22_DSR2014: Bailey, D. H., López de Prado, M. (2014). “The Deflated Sharpe Ratio.” Authors’ 2014-07-31 preprint. Supports the equation in Section 6.5.
- CH22_PBO2015: Bailey, D. H., Borwein, J. M., López de Prado, M., Zhu, Q. J. (2015). “The Probability of Backtest Overfitting.” Authors’ preprint. Used only as a conceptual preview in Sections 5 and 19.
- CH22_GELMANLOKEN2013: Gelman, A., Loken, E. (2013). “The garden of forking paths.” Unpublished working paper. Supports Sections 2, 3, and 5.
- CH22_JT1993: Jegadeesh, N., Titman, S. (1993). “Returns to Buying Winners and Selling Losers.” Journal of Finance 48(1), printed pages 68–69; supports the Bonferroni discussion of 32 strategies in Section 7.
- FRENCH: Kenneth R. French Data Library, 10 Industry Portfolios (frozen snapshot and hash in Section 11 and
data/manifests/french_industries_2026-10-05.json).