CHAPTER 35/ 45
Transaction Costs
Prior engineering evidence is cited under its original acceptance status. Through-line: map optimizer target weights and ideal prices through spread, slippage, impact, fees, financing, and borrow costs to scenario-specific fill quantities, cash changes, and ending net asset value (NAV). Prevent frictions already embedded in fill prices from being charged again as cash expenses, and establish self-financing and capacity-sensitive boundaries for net-return accounting. Prerequisites: Chapter 29, Backtest Ledgers; and Chapter 34, Market Microstructure. After reading, you should be able to separate the pricing logic for commissions, spreads, slippage, temporary impact, and permanent impact; derive the closed-form purchasable quantity under a self-financing constraint; post cash entries without double counting; hand-reconcile a complete implementation-shortfall ledger with partial fills and multi-asset frictions; and build turnover and capacity sensitivity analyses, including a strategy's break-even AUM.
1. Learning Objectives
In quantitative investing and multifactor research, paper portfolios and portfolios net of costs use different assumptions about fills and expenses. An optimizer that ignores execution constraints may recommend turnover beyond what a strategy can support. Realized results also depend on spreads, impact, commissions, financing, borrow, execution windows, and fill data. The examples in this course use explicit constructed inputs to demonstrate accounting methods; they do not describe a real strategy or market sample.
After completing this chapter, you should be able to demonstrate five professional competencies:
- Cost categories and units. Distinguish explicit fees (commissions, exchange fees, and taxes), implicit costs (bid-ask spread, slippage, temporary impact, and permanent impact), and position-carry costs (financing interest and borrow fees). Use USD per share, shares, total cash in USD, basis points (bps, where
), and annualized percentages consistently; do not mix dimensions in an equation. - Avoiding double charges and reconciling the ledger. Understand how implicit costs enter the execution price. Prove that once the fill price includes the half-spread and temporary impact, debiting the actual fill notional from cash must not be followed by a second cash debit for spread or impact. Prove that permanent impact changes the subsequent reference-price path and is reflected through valuation, rather than posted again as a cash flow.
- Solving for self-financing trades. Understand how trading frictions feed back into purchasable asset quantities. Given cash and target weights, write the nonlinear self-financing equation with slippage and fees, and derive the corrected purchase quantity for single- and multi-asset cases so a backtest does not overdraw cash.
- Reconciling implementation shortfall (IS). Attribute the difference between a paper decision and the executed outcome to delay cost, execution friction, opportunity cost on unfilled shares, and explicit fees. Prove the algebraic decomposition and its equality to the direct cash-difference method.
- Capacity and calibration boundaries. Apply square-root and linear impact models within their limits; distinguish constructed scenario inputs from empirical calibration to institutional data; and derive the relationship among turnover, AUM, and net returns, including the AUM at which a strategy reaches break-even.
Completion criterion: you can independently hand-calculate the multi-asset example in Section 8 and match its fill quantities, prices, cash balance, fee details, and ending NAV to the cent. You can also identify the code and accounting defects in the double-charge example in Section 12 and state the correct repair.
2. Why Quant Needs It
A quantitative strategy's life cycle runs from a signal to net profit:
[Factor signals / Alpha model]
        |
        v (decision time: signal_time)
[Portfolio optimizer: target weights w*]
        |
        v (order submission and routing: order_send_time)
[Execution algorithm and matching: trade_time] ---> spread, impact, slippage, commission
        |
        v (actual fills: F = Q - R)
[Account and ledger update: fill_time] ---> cash debit/credit, position update, financing/borrow accrual
        |
        v (valuation: mark_time)
[NAV and capacity assessment] ---> determines the capital scale the strategy can support
Ignoring trading costs overstates the net return a paper portfolio can realize:
- High-turnover scenario: Costs accumulate on actual traded notional in the tradable risky assets. Suppose a constructed example invests the entire portfolio in tradable stocks, has one-sided annual turnover
, and incurs an average cost of 15 bps per dollar of actual traded notional. Using total stock turnover of , the cost is about bps of beginning-of-period NAV. Changes in the cash weight do not enter stock traded notional. This is arithmetic only, not a universal input for any strategy or market. - Liquidity differences: The same share quantity can incur different costs under different quoted depth, volume, and volatility conditions. Without historical order-book and trade data for each security, a researcher can run transparent scenarios but cannot present an assumed spread as a market fact.
- Borrow constraints: Short orders also depend on borrow availability, rates, recalls, and the conditions for buying to cover. Without timestamped historical borrow records, a backtest must use explicit scenario inputs; it cannot assume that every stock is always borrowable.
- Scale sensitivity: As assets under management rise, target orders may become larger relative to available liquidity. How costs scale depends on the execution model and calibration data. This chapter uses constructed functions to illustrate that dependence; it gives no universal capacity threshold.
Chapter 29 established a discrete self-financing ledger, and Chapter 34 unpacked limit order books and market matching. This chapter connects the two: it models spreads and impact, feeds them into Chapter 29's cash ledger, and shows how trading frictions affect portfolio compounding. It also supplies the cost-accounting foundations for Chapter 36's execution methods—TWAP, forecast-volume VWAP, POV, and implementation shortfall.
3. Intuition
3.1 A Used-Car Analogy
A used-car purchase is an intuitive way to think about trading costs. Suppose the fair midpoint valuation of a model is USD 20,000:
- Bid-ask spread: A dealer will pay USD 19,500 if you sell the car (the bid) and ask USD 20,500 if you buy the same model (the ask). The USD 1,000 difference is the quoted spread. At the USD 20,000 midpoint valuation, a buyer immediately incurs half the spread, or USD 500.
- Explicit commission and fees: The motor-vehicle authority charges a USD 200 transfer fee and transaction tax. This is an explicit cash expense.
- Market impact: Suppose you need 50 cars that afternoon to start a rental business, but local dealers have too little inventory and must source more cars at higher prices. The first car costs USD 20,500, the twentieth costs USD 21,000, and the fiftieth costs USD 22,000. Your large, urgent purchase has moved prices against you: this is market impact.
- Temporary versus permanent impact: After you leave with the 50 cars, the buying pressure subsides and the dealer's ask falls from USD 22,000 to USD 20,800. To compare like with like, suppose the pre-trade midpoint is USD 20,000 and the half-spread is USD 500, so the pre-trade ask is USD 20,500. During the busiest part of the purchase, the ask reaches USD 22,000. If the post-trade ask is USD 20,800 and the half-spread remains USD 500, the corresponding midpoint is USD 20,300. This constructed path labels the USD 1,200 difference between the busy-period ask and the post-trade ask as temporary, and the USD 300 difference between the post-trade and pre-trade midpoints as permanent. It is a specified hypothetical path: a finite observation window cannot establish that impact is permanent or that prices will recover at any particular speed.
- Financing and stock borrow: If you borrow money from a bank to buy the car, you pay financing interest. If you borrow a friend's car, sell it, and promise to buy another one to return in a month, you pay a rental fee analogous to stock-borrow cost.
3.2 Why You Must Not Charge the Same Cost Twice
A common accounting error is to charge a friction twice. Suppose you buy a car from a dealer for USD 20,500. The fair midpoint value is USD 20,000, so the purchase price already includes the USD 500 half-spread. You also pay a USD 200 transfer fee.
Your cash falls by USD 20,500 + USD 200 = USD 20,700. You receive one car, valued at USD 20,000 at the midpoint. Your net assets therefore fall by USD 700: the USD 500 half-spread plus the USD 200 transfer fee.
The USD 500 spread loss is already reflected in the USD 20,500 purchase price. If backtest code debits USD 20,500 for the car and then separately debits a USD 500 “spread fee,” cash falls by USD 21,200. The spread has been charged twice.
The accounting rule is simple: the fill price absorbs spread and impact, explicit fees are debited separately, and modeled permanent price changes enter through valuation; never post the same cost twice.
4. Mathematical Foundations
Before defining each trading cost, we fix the notation, variable dimensions, and units.
4.1 Core Variables and Dimensions
At a rebalance time, let the portfolio contain
: midpoint-price vector at time , in USD per share. : best ask and bid vectors, in USD per share, with . : quoted spread in USD per share. The relative spread is , dimensionless or reported in bps. : signed parent-order quantity in shares. is a buy and is a sell. : signed filled quantity in shares. It satisfies ; when , . Zero fills are allowed. : signed cutoff remainder in shares. : available cash in USD at time . means cash borrowing or leverage. : holdings in shares at time . means a short position. : net asset value in USD, marked at the stated valuation prices.
4.2 Basis Points and Percentages
Small trading proportions are often stated in basis points (bps):
For example, 15 bps equals 0.15% or 0.0015. At a share price of USD 50.00, a 20-bps spread corresponds to an absolute amount of
4.3 From Confirmed Fills to Valuation: Post First, Then Compare Benchmarks
Continue the small connection example from Chapter 34. A request for
The four IS components for this buy are
The USD 3.20 opportunity cost did not buy any shares, and the USD 2.00 delay cost was not paid to anyone. Both are attribution components. If total IS were debited from cash after the fill had already been posted, NAV would be incorrectly reduced to USD 1,995.40, a second charge of USD 7.30. Section 6.2 proves the general signed identity; Section 8 preserves the full multi-asset, corporate-action, and financing ledger example.
5. Formal Definitions
This section gives the mathematical and financial definitions of the main components of trading costs.
5.1 Commissions and Explicit Fees
Definition 5.1 (Explicit Fees). Explicit fees are cash expenses charged directly for trading activity by a broker, clearing house, exchange, or regulator. Denote them by
- Per-share commission:
, where is a fee per share (for example, ). - Notional commission:
, where is a dimensionless rate (for example, 1.5 bps = 0.00015). - Other transaction fees and taxes: where a model includes these items, their schedules must be specified for the relevant venue, product, and account. This chapter makes no claim about the current fee or tax rules of any jurisdiction. The sell-side term in the equation below is an optional modeling term, not a universal legal rule.
The combined explicit-fee function is
Conditions and properties: In this chapter’s ledger model, commission is fill-based and applies only to actual fills
5.2 Bid-Ask Spread
Definition 5.2 (Effective and Realized Spread). Let an order reach the market at time
-
Quoted spread:
. The relative quoted spread is . -
Effective half-spread cost: For a child order filled at
at time , the one-sided move from the arrival midpoint equals half the spread in the no-impact limit. For signed fill quantity , a buy ( ) executes at the ask and a sell ( ) at the bid: The total spread amount paid on the fill, in USD, is
Condition: This formula assumes the order size does not exceed displayed quantity at the best level. When an order consumes multiple levels, depth slippage and market impact must also be considered.
5.3 Slippage
Definition 5.3 (Slippage). Slippage is the adverse deviation of the actual fill price
- If the reference price is the decision-time midpoint
, slippage includes market drift during decision delay and all execution frictions after arrival. - If the reference price is the arrival midpoint
, slippage includes half-spread and immediate market impact. - The total slippage amount is
. Positive slippage means execution was worse than the reference benchmark.
5.4 Market Impact: Temporary versus Permanent
A large order can disturb supply and demand and move prices against the trader. Almgren and Chriss (2000) formalized a decomposition of this effect into temporary and permanent impact.
Definition 5.4 (Temporary Impact). A trader demanding immediate liquidity temporarily consumes order-book depth, making the fill VWAP worse than the contemporaneous midpoint in the absence of the trader's order. In this model, this component enters the fill price but not the post-trade reference midpoint. That modeling convention does not establish that real prices recover quickly; recovery speed must be tested with event data.
Suppose a trade is executed at rate
where
Fix the volatility measurement window in advance. For example, let
Definition 5.5 (Permanent Impact). In this model, a price change attributed to the trader's order and retained in the post-trade reference midpoint is called permanent impact. The formula is a definition of a model component; it does not mean that a finite observation window has established permanent real-world impact, that private information caused the change, or that a causal effect has been identified:
where
where
Mapping to the execution engine. The equations above are abstract volatility-scaled scenarios. The current fill model in quant_course.execution_costs uses
The coefficients
For example, with arrival price 50, daily return standard deviation 2%, slot participation 4%,
Key distinction:
- Temporary impact
affects only this order's fill price ; it does not change the model's post-trade equilibrium midpoint. - Permanent impact
changes the post-trade midpoint , which affects subsequent arrival prices and the mark-to-market value of positions already held.
5.5 Financing Interest and Stock-Borrow Fees
Definition 5.6 (Cash-Financing Cost). When an investor buys assets with leverage and the cash balance becomes negative (
With negative cash, the financing expense is
Definition 5.7 (Stock-Borrow Fees). An investor holding a short position (
where
Financing and borrow use Chapter 29's single monotone ledger event clock. For interval
In this batch's constructed Project 4 execution window, each slot-end midpoint is recorded as a new mark event, even when the slot has no fill. The same rule applies to a position that remains open but is not rebalanced that month. The old mark accrues through slot end; the new mark is used only for later intervals. This slot-end mark availability is an explicit experiment convention, not a claim that real market quotes are available with the same latency.
Segmented accounting example (ACT/360, zero commission): On day 0, cash is USD 100,000. Short 100 shares of A at USD 100, with the same USD 100 mark available, so cash after the short sale is USD 110,000. The annual cash rate is 4% and A's annual borrow rate is 1.5%. For day 0 through day 10, accrue on the opening cash and short position: interest is
Note: If a shorted security pays a dividend while the short is open, the short seller must compensate the lender for the full cash dividend (a manufactured dividend). This is debited directly from the cash account.
5.6 Turnover Conventions
Definition 5.8 (Turnover and the Tradable-Security Set). Let the tradable risky securities be
-
One-sided risky-asset turnover:
-
Total requested risky-asset notional turnover:
corresponding to requested notional
. Actual commissions, spread, and temporary impact are charged only on actual risky-asset traded notional . The unfilled part enters opportunity-cost attribution only. -
All-asset weight reallocation may be defined separately as
but it is not stock traded turnover. A change in cash weight is a settlement difference; it does not create a stock fill, spread, impact, or commission. Do not use it in
.
For a monthly portfolio, report annualized turnover as 12 times average monthly turnover. Intraday execution slices do not turn monthly signals or returns into daily-frequency statistics.
6. Derivations
6.1 Cash-Ledger Recursion and Proof Against Double Charging
Following Chapter 29's event clock and the A7-B interface contract, we derive the ledger recursion from discrete accounting conservation.
Immediately before rebalancing at
The new holdings vector is
Proposition 6.1 (Embedded Costs Must Not Be Charged Again). Suppose that for every
Then the half-spread and temporary impact have already been fully settled through the cash account. They must not be deducted a second time as cash fees.
Proof. Substitute
Since
The terms on the right are, respectively:
: transaction cash measured at the frictionless midpoint; : the cash consumed by the half-spread; : the cash consumed by temporary impact; and : explicit trading commissions and fees.
Thus
which double counts the spread and temporary impact and creates a fictitious cash loss. This proves the claim.\hfill
6.2 Equivalence Between NAV Changes and Implementation Shortfall
The Perold (1988) entry is included here as a bibliographic record only. The 2026-10-09 source review checked publisher and author metadata; it did not read the paper itself. This batch carried forward that historical status without a new search or full-text review. The SEC (2003) document notes that, at the time, there was no universally accepted method for calculating portfolio implementation shortfall and discusses the concept's historical origins. This section adopts an explicit teaching convention: the difference between paper-portfolio PnL and actual-portfolio PnL. The decomposition into decision price, arrival price, cutoff price, and unfilled opportunity cost is the convention stated in this chapter; it is not a claim that all current markets or regulatory regimes use the same formula.
Suppose the investment decision is made at
Proposition 6.2 (Four-Factor Implementation-Shortfall Decomposition Equals the Direct-Dollar Method). Define implementation shortfall (positive values denote a cost loss) by
It decomposes exactly into the following four terms:
This decomposition is exactly equal to the direct dollar-difference method:
Proof. For each asset
-
Paper-portfolio PnL: The paper portfolio assumes that the entire parent order
is filled at at decision time and incurs no explicit fee. At , it marks the paper holdings at , so -
Actual-portfolio PnL: The actual portfolio holds only the filled quantity
and is marked at at cutoff. The actual fill payment and explicit fees are . Therefore,
Subtract the two:
Using the remainder identity
Combining the terms involving
This yields the direct dollar-difference method:
Next, introduce the arrival midpoint
Substituting gives
Using
The four terms represent, in order:
: delay cost from price movement between the decision and the order's arrival at the market. : execution-friction cost from spread and market impact on actual fills; this empty sum is zero when there are no fills. : opportunity cost from market movement on the unfilled remainder. : explicit cash fees paid to exchanges and brokers.
The algebraic identity follows.\hfill
This chapter assigns the decision-to-arrival price movement on the full parent order
6.3 Deriving the Self-Financing Share Adjustment
In Chapter 29, an optimizer may propose a target weight
Consider a single-asset buy. The account has available cash
For a purchase of
The total cash required is
The strict self-financing constraint requires total outlay not to exceed available cash:
Rearranging gives a quadratic in the share quantity
Since
If nonlinear impact is ignored (
Thus, frictions strictly reduce the physical number of shares that can be purchased. If commission and half-spread are omitted from the denominator and the order is instead set to
6.4 Deriving Strategy Capacity and the Decline in Marginal Net Returns
This section uses a dimensionally closed square-root scenario model to illustrate sensitivity to scale. Let
while the matching market-volume proxy over the evaluation period is
This is an input for scenario comparisons, not a liquidity guarantee that can be used directly to place orders.
Assume a fixed cost rate
Therefore,
Let
The ratio
The time frequency must be consistent. The standard monthly example uses 21 trading days, monthly gross return, and one-sided monthly turnover. If annualized turnover is reported, derive it by multiplying monthly turnover by 12; do not mix annualized turnover with monthly gross return or
7. Financial Interpretation
Returning from mathematical formulas to the actual mechanics of financial trading, quantitative researchers should understand three economic principles.
7.1 Spreads and Liquidity Provision
A spread can compensate liquidity providers for inventory risk, adverse selection, and operating costs. The relative importance of these factors varies across market structures, order types, and market conditions; a spread is not a fixed “insurance premium” determined by a single cause. Temporary impact describes the deviation of a fill from its benchmark when a trader demands immediacy.
7.2 The Relationship Between Frequency, Turnover, and Cost
Higher turnover causes a fixed fee rate to recur across more actual traded notional. Whether costs overwhelm gross returns depends on trade size, asset liquidity, and execution method. A convenient constructed scenario for hand calculation assumes a portfolio fully invested in tradable stocks, one-sided annualized turnover
7.3 Asymmetry in the Availability and Timing of Stock-Borrow Fees
Borrow fees depend on the security, the available loan supply, and the billing time; they are not constants determined solely by a short signal. General availability and scarce loan supply can correspond to different rates. Whether a borrow is available, when it may be recalled, and how much liquidity is needed to cover the short position require timestamped borrow and execution records for backtesting. Without such sources, the examples in this book demonstrate only the cash accounting identity “rate × actual borrowed market value × accrual fraction”; they do not infer real loan availability or recall losses.
8. Numerical Example
This section presents a complete constructed teaching example that runs through all the formulas and can be checked by hand. All values are explicitly labeled as constructed for teaching.
8.1 Initial Account and Market State
Consider a portfolio with assets under management of USD 1,000,000.00.
- Current time: 2026-10-12 09:15:00 EDT (America/New_York, UTC-04:00), the decision and signal time
. - Execution time: 2026-10-12 09:30:00 EDT (America/New_York, UTC-04:00), when the order reaches the market,
. - Initial holdings and cash at
: - Stock A (large-cap, liquid): 5,000 shares held; arrival midpoint
; market value USD 500,000.00 (50.0%). - Stock B (mid-cap growth): 0 shares held; arrival midpoint
; market value USD 0.00 (0.0%). - Stock C (security used for a short hedge): 0 shares held; arrival midpoint
; market value USD 0.00 (0.0%). - Cash balance
: USD 500,000.00 (50.0%). - Initial NAV:
.
- Stock A (large-cap, liquid): 5,000 shares held; arrival midpoint
8.2 Market Quotes and Friction Parameters (Constructed for Teaching)
Quote inputs (all prices are USD per share; quoted spread is ask minus bid):
| Asset | Arrival midpoint |
Best bid (USD/share) | Best ask (USD/share) | Quoted spread (USD/share; bps) |
|---|---|---|---|---|
| Stock A | USD 100.00 | USD 99.98 | USD 100.02 | USD 0.04 (4 bps) |
| Stock B | USD 50.00 | USD 49.95 | USD 50.05 | USD 0.10 (20 bps) |
| Stock C | USD 40.00 | USD 39.96 | USD 40.04 | USD 0.08 (20 bps) |
In this example, the per-share price offset from impact equals a slope times the filled quantity. The linear-impact slope is measured in USD/share
| Asset | Temporary-impact slope |
Permanent-impact slope |
Commission |
Annual borrow rate |
|---|---|---|---|---|
| Stock A | USD 0.005 | 0.5% | ||
| Stock B | USD 0.005 | 1.0% | ||
| Stock C | USD 0.005 | 3.65% (hard to borrow, HTB) |
8.3 Intended Rebalance Targets and Order Generation
At 09:15:00, the optimizer assigns new target weights based on factor scores. Target weights are locked at 09:15:00. To avoid using a future price as a decision input, this constructed example explicitly stipulates that each asset’s decision midpoint equals its arrival midpoint,
- Stock A: reduce to a target weight of 20.0% (target market value USD 200,000.00, or a target of 2,000 shares).
- Order A: sell 3,000 shares (
shares).
- Order A: sell 3,000 shares (
- Stock B: establish a 60.0% target weight (target market value USD 600,000.00, or 12,000 shares).
- Order B: buy 12,000 shares (
shares).
- Order B: buy 12,000 shares (
- Stock C: establish a short position with a target weight of
(target market value , or a short sale of 2,000 shares). - Order C: sell short 2,000 shares (
shares).
- Order C: sell short 2,000 shares (
- Cash: target residual weight of 28.0%.
8.4 Step-by-Step Fill Prices and Cost Details
All orders fill completely during the execution window from 09:30:00 to 10:00:00 (
1. Stock A Execution (Sell 3,000 Shares,
-
Half-spread deduction:
. -
Temporary-impact deduction:
. -
Actual average sale price:
-
Actual traded notional before net cash proceeds:
. -
Stock A commission:
. -
Permanent impact changes the market midpoint:
. The new benchmark midpoint after execution is .
2. Stock B Execution (Buy 12,000 Shares,
-
Half-spread addition:
. -
Temporary-impact addition:
. -
Actual average purchase price:
-
Actual purchase notional:
. -
Stock B commission:
. -
Permanent impact changes the market midpoint:
. The new benchmark midpoint after execution is .
3. Stock C Execution (Short-Sell 2,000 Shares,
-
Half-spread deduction:
. -
Temporary-impact deduction:
. -
Actual average short-sale price:
-
Notional proceeds from the short sale:
. -
Stock C commission:
. -
Permanent impact changes the market midpoint:
. The new benchmark midpoint after execution is .
8.5 Cash Account and Holdings Reconciliation
The cash ledger follows the formula derived in Section 6. This constructed example treats short-sale proceeds as immediately usable cash and imposes no restricted margin, collateral haircut, or broker restriction on the use of short-sale proceeds. This is an assumed account-contract boundary, not a statement about the cash-availability rules of every account:
Substituting the values:
(a sale, so cash increases by USD 299,850.00). (a purchase, so cash decreases by USD 601,800.00). (a short sale, so cash increases by USD 79,860.00). - Total commission:
.
Net cash change:
Ending cash balance:
Update share holdings and market values using the new midpoints
- Stock A:
shares held; market value . - Stock B:
shares held; market value . - Stock C:
shares held (short); short-liability value . - Cash: USD 277,825.00.
Ending NAV (
Relative to initial NAV of USD 1,000,000.00, the rebalance reduces NAV by
8.6 Cost-Attribution Ablation and Exact Implementation-Shortfall Reconciliation
We attribute the USD 1,695.00 NAV loss term by term:
| Item | Stock A (USD) | Stock B (USD) | Stock C (USD) | Total (USD) |
|---|---|---|---|---|
| Explicit commissions on actual fills | -15.00 | -60.00 | -10.00 | -85.00 |
| Half-spread and temporary impact (already in fill price) | -150.00 | -1,800.00 | -140.00 | -2,090.00 |
| Change in ending holdings mark after permanent impact, |
-20.00 | +480.00 | +20.00 | +480.00 |
| Ending NAV change | -185.00 | -1,380.00 | -130.00 | -1,695.00 |
Reconciliation. Execution shortfall relative to the arrival midpoint, excluding revaluation of existing holdings, is USD 85 in commissions plus USD 2,090 in fill slippage, for implementation shortfall of USD 2,175. The ending holdings are marked at the post-permanent-impact midpoints, producing a total mark change of +USD 480. Therefore,
The fill price already includes half-spread and temporary impact. Cash is posted using the actual fill price and commission; the table reports spread and impact as attribution components and does not deduct them from cash again.
Now calculate implementation shortfall independently using the arrival price as benchmark (
- Stock A:
. - Stock B:
. - Stock C:
. - Explicit commissions: USD 85.00.
Total implementation shortfall:
Think it through: Why is implementation shortfall (USD 2,175.00) not equal to the NAV loss (USD 1,695.00)?
Implementation shortfall measures realized execution friction relative to the arrival price. Ending NAV also marks holdings at the new midpoint. In this example, the constructed permanent-impact path changes the ending holdings mark by
8.7 Multi-Period Stock-Borrow Fees and Holdings Returns
Assume the portfolio holds these positions for 30 calendar days (
-
Under the same constructed assumption, short-sale proceeds remain usable cash over these 30 days and earn the positive cash-credit rate. If an actual broker segregates or restricts these proceeds, the cash-yield and financing treatment must be recalculated under that contract.
-
The USD 277,825.00 cash balance earns a 2.0% annual cash-credit rate:
-
Stock C has a short market value of USD 79,980.00 and an annual borrow-fee rate of 3.65% (hard to borrow, HTB):
At month-end, after the borrow fee is charged and cash interest is credited, net cash is
The net financing return on funds tied up by these positions over one month is
8.8 Constructed Cost-Sensitivity Experiment
Suppose the monthly gross excess-return rate is 120 bps, one-sided monthly turnover of the tradable stock universe is
| AUM (USD) | One-sided monthly turnover |
Total traded notional (USD) | Impact rate (bps/traded notional) | Total cost rate (bps/traded notional) | Cost (USD) | Net return (bps/NAV) | Net return (USD) |
|---|---|---|---|---|---|---|---|
| 1,000,000 | 0.20 | 400,000 | 6.90 | 15.15 | 606.03 | 113.94 | 11,393.97 |
| 1,000,000 | 1.00 | 2,000,000 | 15.43 | 23.68 | 4,736.07 | 72.64 | 7,263.93 |
| 1,000,000 | 3.00 | 6,000,000 | 26.73 | 34.98 | 20,985.67 | -89.86 | -8,985.67 |
| 10,000,000 | 1.00 | 20,000,000 | 48.80 | 57.05 | 114,090.01 | 5.91 | 5,909.99 |
| 20,000,000 | 1.00 | 40,000,000 | 69.01 | 77.26 | 309,026.22 | -34.51 | -69,026.22 |
The first two columns show how turnover and scale have different effects on unit traded-notional impact. For the one-sided monthly-turnover scenario of 1, the model gives a break-even AUM of about USD 11.25 million and a maximum net dollar return at about USD 5.00 million. Both are teaching values implied by these assumptions, not historical backtest results or investment advice.
9. Python Implementation
This chapter and Chapter 36 share src/quant_course/execution_costs.py; the experiment report and notebook call the same cost and execution core. The static I3 notebook inspection records that its default path has four cells, uses a small constructed ledger/IS example, and produces one figure. The Notebook creates its own unique RUN_DIR for fresh numerical and graphical outputs. The outer runner separately creates a unique execution directory for the executed Notebook copy and execution.json. This is not a full Project 4 CLI run. The English Notebook language layer remains assigned to BIL23. Common objects include:
| Interface | Purpose |
|---|---|
ExecutionConfig |
Commission, half-spread, temporary/permanent impact, participation cap, positive-cash credit rate, negative-cash borrowing rate, borrow fee, and day-count convention; inputs are checked at construction. If no separate borrowing rate is supplied, the cash rate is used for compatibility. |
ParentOrder |
Signed parent order, decision/arrival times, and prices. Buy quantities are positive; sell quantities are negative. |
ExecutionSlot |
Send, fill, and slice times, plus forecast, observed, and realized external volume; observation_time establishes that a POV observation was available before the send time. |
execute_order |
Generates child orders and simulates fills using TWAP, an ex ante forecast curve VWAP, or lagged observed volume POV. |
ExecutionPortfolioLedger |
Posts each fill to cash and holdings; spread and temporary impact enter only through the fill price, while permanent impact enters subsequent marks. |
The example below shows the actual API for a parent order, one execution slot, IS decomposition, and cash accounting. The test file checks the complete boundaries, buy/sell direction, partial and zero fills, and leakage counterexamples through regression tests.
import datetime as dt
from datetime import timezone
import math

from quant_course.execution_costs import (
    ExecutionConfig, ExecutionPortfolioLedger, ExecutionSlot,
    ParentOrder, execute_order,
)

utc = timezone.utc
start = dt.datetime(2026, 10, 12, 13, 30, tzinfo=utc)
parent = ParentOrder(
    order_id="order-1", asset="XYZ", signed_quantity=1_000,
    decision_time=start - dt.timedelta(minutes=5), parent_received_at=start, arrival_time=start,
    decision_price=99.95, arrival_price=100.00,
)
slot = ExecutionSlot(
    slot_index=0, slot_start=start, slot_end=start + dt.timedelta(minutes=30),
    send_time=start, child_venue_arrival_at=start,
    fill_time=start + dt.timedelta(minutes=15), forecast_frozen_at=start - dt.timedelta(minutes=1),
    forecast_external_volume=5_000, observed_external_volume=0,
    realized_external_volume=5_000, mid_price=100.00,
)
config = ExecutionConfig(
    commission_rate=0.0005,       # 5 bps of actual fill notional
    half_spread_bps=2.5,
    temp_impact_coef=0.001,
    max_participation=0.20,
)
result = execute_order(
    parent, "TWAP", [slot], config,
    terminal_mark_price=100.10,
    terminal_mark_time=slot.slot_end,
)
assert result.signed_parent_quantity == result.signed_filled_quantity + result.signed_remainder_quantity
assert math.isclose(
    result.is_decomposition.total_is_decomposition,
    result.is_decomposition.total_is_direct,
    rel_tol=0.0, abs_tol=1e-10,
)

ledger = ExecutionPortfolioLedger(100_000.0, config, parent.decision_time)
for fill in sorted(result.fills, key=lambda item: item.fill_at):
    # Mark at the price observable with this fill; do not backfill the later terminal mark.
    ledger.post_fill(parent.asset, fill, {parent.asset: fill.mid_price})
ledger.accrue_interest_and_borrow(
    result.terminal_mark_time, {parent.asset: result.terminal_mark_price}
)
assert ledger.reconcile_ledger()["is_exact"] == 1.0
fill_vwap is None when there are no fills. Commission on executed trades is calculated from actual traded notional. The cash update deducts only the fill payment and commission, without deducting spread or temporary impact a second time after those costs have entered the fill price. Permanent impact affects only the subsequent price path and NAV marks. The complete interface, causal constraints, and exercise implementations are documented in the tests and Project 4 experiment files.
10. Visualization
This section reuses two constructed teaching figures inherited from the input candidate; this language batch did not regenerate them. Their curve formulas and inputs correspond to Section 8.8; the ablation figure comes from Project 4's fixed-seed, 24-month, layer-by-layer cost scenario. They illustrate relationships internal to the model, not market capacity or estimates of real performance.
10.1 Net Excess Return and Strategy-Capacity Curve
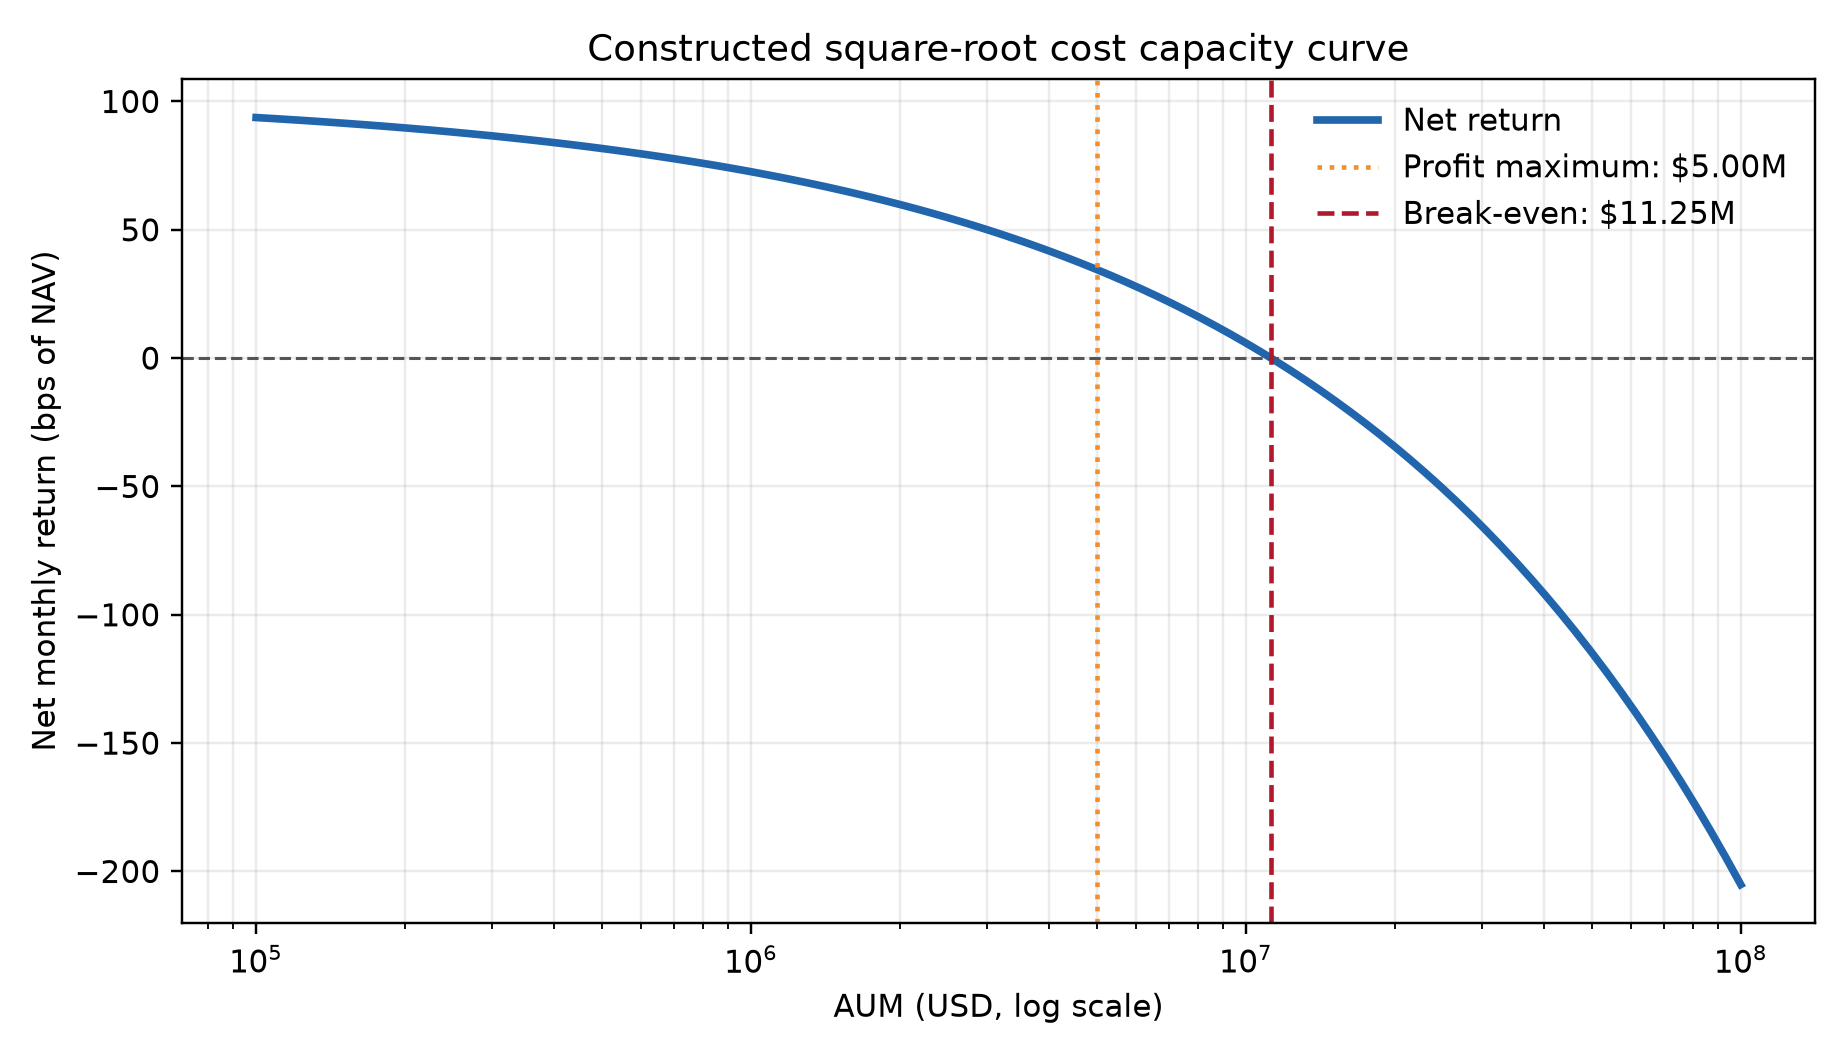
The figure fixes monthly gross excess return at 120 bps, one-sided monthly turnover at 1, 21 trading days, market ADV at USD 100 million per day, fixed unit traded-notional cost at 8.25 bps, and square-root impact coefficient at 0.05. The horizontal axis is AUM in USD on a logarithmic scale; the vertical axis is monthly net return. Under these assumptions, break-even AUM is about USD 11.248 million, and maximum net dollar return occurs at about USD 4.999 million. These values apply only to the parameters shown in the figure.
10.2 Rebalance-Cost Ablation Waterfall
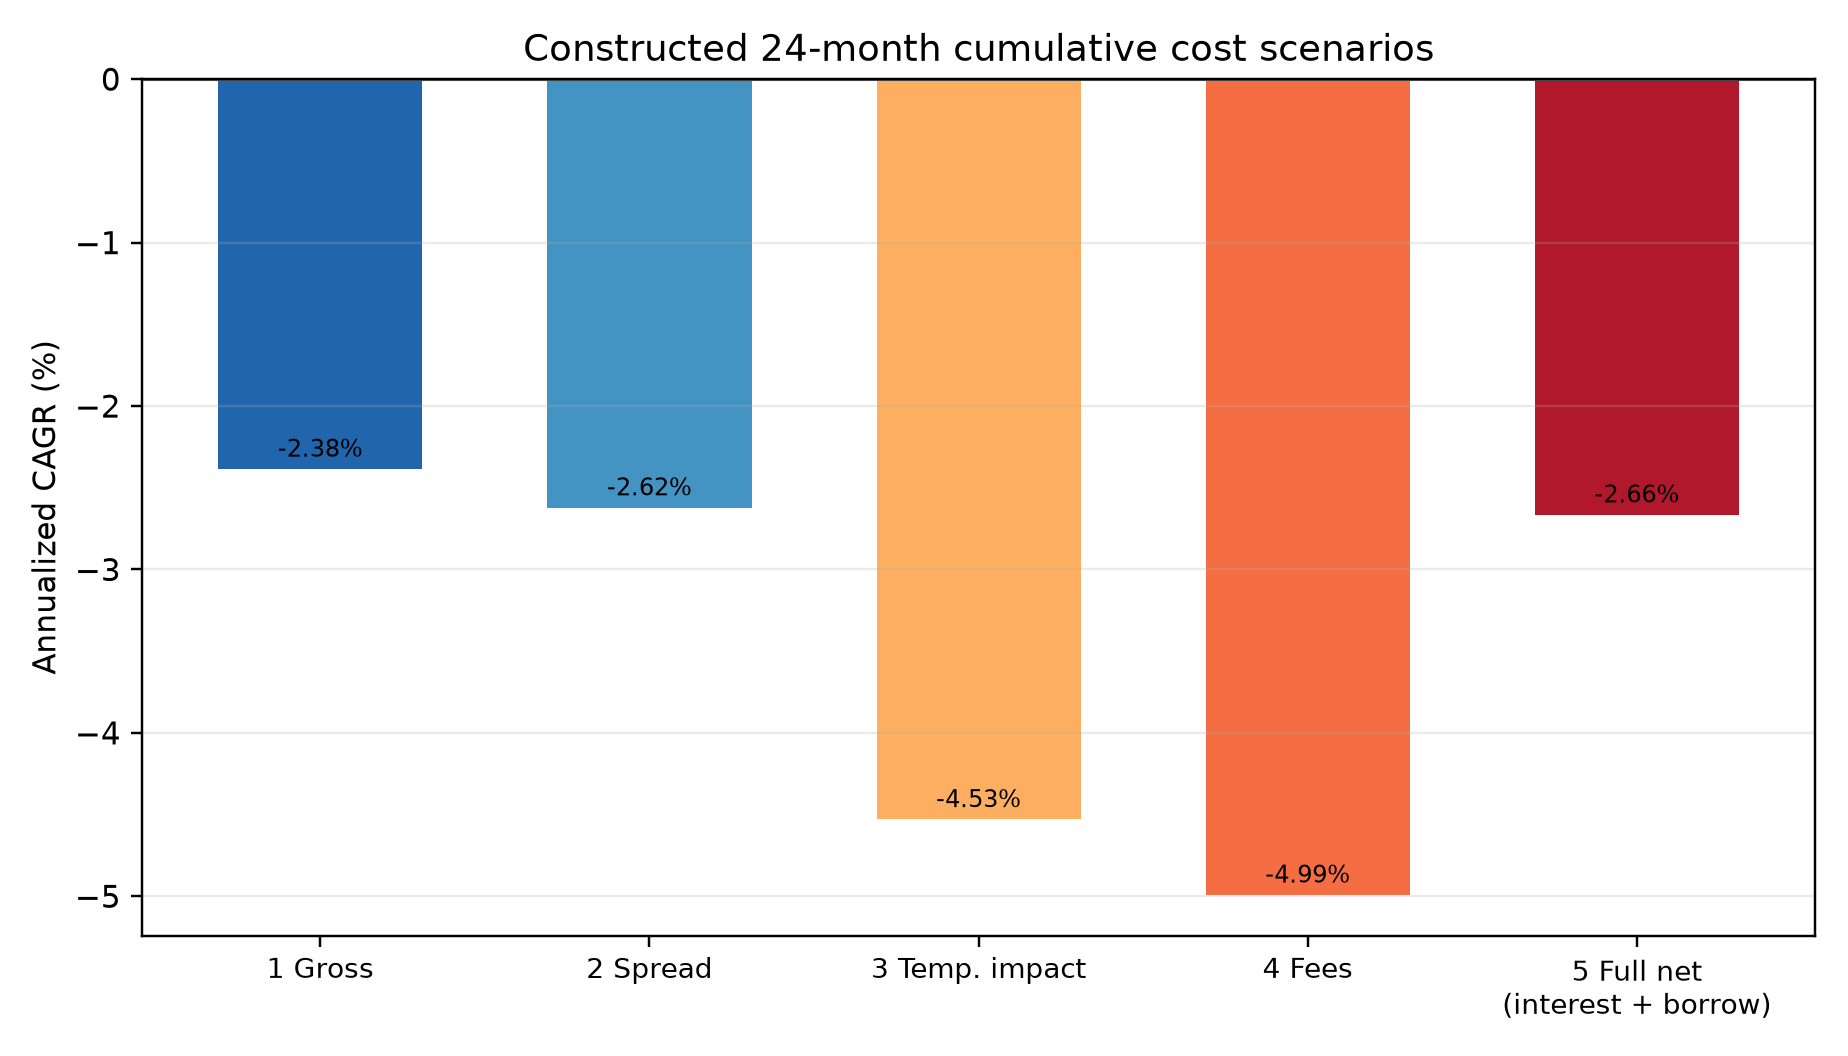
The vertical axis is annualized CAGR calculated from the staged NAV series in the 24-month constructed sample. Each bar enables one additional cost layer in a fixed order. Since the sample path, cash interest, and borrow fees interact, this is a cumulative scenario comparison; differences between adjacent bars should not be interpreted as universal causal costs for individual components.
10.3 Fix the Result Identity Before Reading the Figures
The 24-month cost-ablation figure and the original A7-B R2R6 values retain their historical constructed-path identity; they are not the result of the current signal-interface refresh dated 2026-10-14. The historical signal implementation SHA-256 is e16d97c61fea2f8cab1e7b80a6f20442232507e8b35b4bb2c1a1a2b51f0d0373; do not combine the old figure with a new results table.
The current consumer was refreshed and its scope-limited acceptance recorded by the original main controller using the original CLI/config/seed 20261210 and six fixed experiments. The entrypoint is projects/project04/cost_execution_lab/ACCEPTED_CURRENT_SIGNAL_20261014.md. The current signal implementation SHA-256 is b5357c4122116bacecb585ffe6625a7d14b9dc85c3f65c7ea1dffc744e0a4fd8, and the summary SHA-256 is 3dece7d2fd979d29c5b09b03bc19f54f508963c8e738d6fddc1e58de745e0b4e. These are all CONSTRUCTED_TEACHING_DATA.
For the current 36-period out-of-sample sample, CAGR is GROSS −1.9560%, TWAP −2.3459%, forecast VWAP −2.3327%, and lagged POV −6.0717%; corresponding Sharpes are −0.3334, −0.4014, −0.3994, and −1.0800. The high-friction negative case has full-sample net CAGR −7.4392% and Sharpe −1.5050. These negative results are retained; comparisons apply only to the same constructed path and fixed scenarios. The consumer refresh followed a correction to an exposed input implementation; it involved no new preregistration and did not calibrate real Alpha, costs, or capacity. This batch reuses that accepted summary and did not rerun the CLI or copy the complete raw CSV.
11. Real-Market Example
In institutional quantitative investing, real trading-cost structures can differ substantially from assumptions in academic models. This section summarizes cost characteristics and the limits of the current quantitative-research data using public regulatory reports and institutional empirical studies.
11.1 Findings in Institutional Empirical Literature
- AQR study of anomaly-trading costs (Frazzini, Israel, and Moskowitz, 2012):
- The AQR team analyzed a database of real institutional executions from 1998 to 2011, covering 19 developed markets and close to USD 1 trillion in trading.
- The working paper reports that estimated costs for several anomaly portfolios, based on actual execution costs, were below estimates in earlier literature based on aggregated transaction or quote data. It also uses portfolio optimization to study the tradeoff between cost and tracking error and reports differences across styles.
- These are results for that institution's sample, period, and portfolio designs. Its impact parameters cannot be generalized as universal constants, and the paper does not establish that every quantitative strategy retains significant returns after costs.
- U.S. SEC Staff Report on Algorithmic Trading (2020):
- The report describes core algorithmic-trading processes in U.S. equities, liquidity provision by automated market makers, and order routing in a multi-venue market.
- It summarizes improvements in several market-quality and liquidity-provision measures under normal conditions and notes that some algorithm types may amplify risk during unusual stress or volatility. It also describes the market's multi-venue, automated structure. This chapter does not extrapolate the report into a general empirical claim about spread or depth differences between large-cap and micro-cap stocks.
- SEC request for comment on mutual-fund transaction-cost disclosure (2003):
- In this historical request for comment, the SEC said that there was then no universally accepted method for calculating portfolio implementation shortfall. It compared measurement approaches and requested comments on specific algorithms, formulas, and the treatment of opportunity cost. This 2003 concept paper does not establish a current universal regulatory formula. Researchers should state and freeze the benchmark used in their experiment.
11.2 Data Available in the Current Teaching Environment and Known Gaps
The inventory in qa/a7/ch35_ch36_batch/SOURCE_DATA_GAP.md defines the data boundaries for the current course stage:
- Available data: The local environment contains monthly industry and factor-return snapshots from Kenneth French (used for macro and broad asset-pricing demonstrations) and constructed monthly signals from the Project 4 preparation layer.
- Missing real-world materials: The local environment does not have per-stock intraday Level 2/Level 3 order-book replay data, daily historical intraday stock-borrow rates and availability flags, or live execution records containing broker dark-pool and smart-routing fills.
- Boundary: All friction parameters in this chapter, examples, and later experiments—including impact coefficients
, participation caps, and borrow rates—are carefully designed teaching inputs. Readers should learn the internally consistent cost model and ledger reconciliation method, but must not treat these constructed inputs as production-market calibrations or infer evidence of a real, profitable Alpha.
12. Common Mistakes
Four trading-cost errors commonly arise in quantitative engineering and strategy research.
Mistake 1: Double-Charging Frictions Embedded in the Fill Price as Cash Fees
What goes wrong:
A backtest matching engine first adjusts the fill price
Incorrect code:
# Incorrect: double charging
fill_price = mid_price + 0.5 * spread + impact  # The buy price already includes the increase.
# Deduct the purchase payment.
cash -= qty * fill_price
# Error: deduct the half-spread and impact loss again!
cash -= qty * (0.5 * spread + impact)
Consequence and numerical error: For a trade buying 10,000 shares at a midpoint of USD 100, with a half-spread of USD 0.05 and temporary impact of USD 0.10, the actual fill price is USD 100.15. The payment is USD 1,001,500, including USD 1,500 of friction. The incorrect code over-debits cash by USD 1,500, doubles the modeled trading friction, and may falsely eliminate a strategy that would otherwise be profitable.
Correct repair:
# Correct ledger entry: the fill price absorbs friction; deduct explicit fees separately.
fill_price = mid_price + 0.5 * spread + impact
cash -= (qty * fill_price + explicit_commission)
Mistake 2: Multiplying by 2 Again After Total Traded Notional Already Includes Both Sides
What goes wrong:
Let one-sided turnover be
Incorrect and corrected forms:
# Incorrect: total_notional already includes both buy and sell notional.
total_notional = np.sum(np.abs(target_weights - current_weights)) * portfolio_nav
# Incorrect: cost_total = 2.0 * total_notional * single_trip_fee_rate
# Correct:
one_sided_turnover = 0.5 * np.sum(np.abs(target_weights - current_weights))
# Total cost, using a rate per dollar traded:
cost_total = total_notional * single_trip_fee_rate
# Equivalently, start from one-sided turnover and multiply by 2 only once:
cost_from_one_sided = (2.0 * one_sided_turnover) * portfolio_nav * single_trip_fee_rate
Mistake 3: Charging Full Commission on Unfilled or Partially Filled Orders
What goes wrong:
In the ledger model used here, a limit order with no fill (
Consequence and repair:
In this model, explicit fill commission is tied to actual executed quantity
# Correct repair
actual_commission = commission_per_share * abs(filled_qty)  # Use filled_qty, not parent_qty.
Mistake 4: Setting Fill VWAP to Zero When There Are No Fills, Which Breaks Return Calculations
What goes wrong:
When a stock is limit-up for the day or liquidity dries up and the fill quantity is zero, the code defaults fill_vwap to 0.0.
Consequence and repair:
If fill_vwap = 0.0, later calculations of slippage or return from the fill price produce the nonsensical result
# Correct repair: with no fills, VWAP must be None or np.nan.
fill_vwap = (total_fill_notional / total_filled_qty) if total_filled_qty > 0 else np.nan
13. Quantitative-Research Applications
In quantitative research, transaction costs should not be added as an after-the-fact patch. They belong as an ex ante constraint embedded directly in the portfolio-optimization objective.
13.1 Cost-Aware Portfolio Optimization
A conventional mean-variance optimizer maximizes expected return while penalizing risk:
Here
This frictionless optimizer can induce frequent small weight changes and generate turnover whose marginal return is below its trading cost. A cost-aware optimizer places trading costs directly in its objective:
If
13.2 Trade Buffers and No-Trade Zones
A researcher can define a no-trade band
14. Chapter Summary
This chapter closes the loop from microstructure frictions to self-financing portfolio accounting:
-
Cost categories and pricing logic: Explicit fees (such as commissions and applicable taxes or fees) are separate cash deductions. Among implicit costs, half-spread and temporary impact are embedded directly in the fill VWAP
; permanent impact changes the new market midpoint and affects later valuation. Financing and borrow fees are settled by period based on balances and the day-count convention. -
The core rule against double charging: Because
already absorbs the half-spread and impact through a worse buy or sell price, do not deduct spread or impact again as a separate fee after posting the actual fill payment to cash. -
Self-financing rebalances: Frictions reduce the physical quantity of an asset that can be purchased. On the buy side, solve the nonlinear self-financing equation to determine order size and prevent an overdraft.
-
Four-component implementation-shortfall decomposition:
This decomposition is algebraically equivalent to the direct-dollar method and provides a benchmark for evaluating trading algorithms.
-
Strategy capacity and life cycle: Marginal market impact rises nonlinearly with AUM, so excess returns may eventually encounter a capacity ceiling. Under the square-root net-return function specified here, the dollar-profit maximum is
of break-even scale; this is not a market constant that can be extrapolated directly.
15. Exercises
35-E01 Conceptual Exercise: Avoiding Double Charges When Frictions Are Embedded in Fill Price
A quantitative researcher writing an event-driven matching engine designs the following ledger logic. For a buy, the matching engine calculates the fill price as
cash_balance -= Q * fill_price
cash_balance -= Q * (0.5 * S)  # Researcher's note: deduct spread loss.
cash_balance -= Q * (impact_coef * Q)  # Researcher's note: deduct impact loss.
cash_balance -= commission
Clearly identify the serious accounting and mathematical error, write the correct cash-recursion formula, and calculate how much more cash the incorrect logic deducts when
35-E02 Hand Calculation: Tradable Risk-Asset Turnover and Total Traded Notional
A multi-asset portfolio manages USD 5,000,000 and contains three stocks plus cash. Assume the pre- and post-trade weights use the same NAV and a common mark, and all orders fill at that mark, so the weight changes map to actual traded stock notional. At the start of the month its weights are
- Calculate one-sided turnover for the tradable risky securities,
. - Calculate the two-sided total traded notional in the stocks, in USD.
- If the combined one-way stock-trading fee and slippage rate is 12 bps, applied to actual buy and sell notional, calculate the total friction cost in USD and in basis points of total portfolio assets.
35-E03 Hand Calculation: Full Four-Factor IS Decomposition with a Partial Fill
A quantitative fund executes a large buy order:
- At decision time
, the stock midpoint is . The planned parent order is shares. - When the order reaches the venue at
, the midpoint has risen to . - At the end of the execution window, the actual fill is
shares at an average price of ; the remaining shares are canceled unfilled. - At the cutoff evaluation time
, the stock midpoint is . - The broker charges a fixed commission of USD 0.005 per share on the actual fill.
Calculate separately: (1) delay cost, execution-friction cost, opportunity cost, and explicit fees; and (2) total implementation shortfall in USD, cross-checked using the direct-dollar method.
35-E04 Hand Calculation: Stock-Borrow Fees and Financing Interest
A leveraged long-short hedge fund holds the following positions on May 1, 2026:
- Long assets with a market value of USD 15,000,000.00.
- A short book of five stocks, with annual borrow rates
and absolute short market values , respectively; total short market value is USD 5,000,000.00. - Available cash is
(a leveraged borrowing balance), with an annual financing rate of 6.00%. - The positions remain unchanged through May 31, 2026 (30 days), using the
day-count convention.
Calculate each security's borrow fee, financing interest, and total erosion in USD. Explain why applying a simple average borrow rate to total short market value gives the wrong answer.
16. Programming Exercises
35-P01 Programming Exercise: Basic Trading-Cost Calculator and Anti-Double-Charge Unit Test
Write a pure function named execution_ledger_step. It takes prior cash, a holdings dictionary, a list of confirmed fill records (the signed quantity in each record is the actual fill
Requirements:
- Calculate half-spread and linear impact for buys and sells.
- Include an explicit per-share commission.
- Assert that zero fills incur no commission, buy fills are not below the midpoint, and sell fills are not above the midpoint.
- Write pytest unit tests with a counterexample showing that a second spread deduction fails the assertion.
35-P02 Programming Exercise: Solver from Self-Financing Target Weights to Actual Filled Shares
Write a numerical solver named solve_purchasable_shares. Given available cash
- Solve for the physical share quantity
that makes total outlay (purchase payment plus commission) equal to , retain an integer number of shares by rounding down. - Return the unused cash residual after rounding down.
- Verify that when frictions are ignored (
, , and ), the solution reduces exactly to .
35-P03 Programming Exercise: Strategy-Capacity Sensitivity and Break-Even Curve
Implement simulate_capacity_curve. Gross return, one-sided turnover, average daily dollar volume (ADV), and the
return net Alpha and dollar net profit over a logarithmic AUM grid, and analytically calculate break-even scale and the AUM maximizing dollar net return. Validate the inputs. If fixed cost already exceeds gross Alpha, or if the impact coefficient is zero, return “no finite capacity solution” explicitly instead of fabricating a number.
17. Challenge Problems
35-C01 Challenge: Tradeoff Between Nonlinear Impact and a Per-Slot Penalty over a Fixed Total Duration
Suppose a trader must buy a total of
This is not a general conclusion that “more slices necessarily reduce impact within a fixed total horizon.” With equal execution across slots, each slot lasts
Also assume that each additional slot incurs a fixed exogenous penalty,
- Write total execution cost (total temporary-impact dollars plus the risk cost) as a function of
. - Derive the analytic optimizer
when impact is linear ( ). - Discuss the convexity of the objective and the extremum condition for the classic square-root impact case (
).
35-C02 Challenge: Net-Return Risk with Borrow Recalls and State-Dependent Costs
Construct an annual long-short portfolio example. Let gross excess return
- Calculate the mean, variance, and net Sharpe, and explain why the result depends on the constructed parameters in this problem.
- Now consider a leveraged short. If the security jumps up by a proportion
at recall, short notional exposure divided by NAV is , and spread plus impact to cover the position is as a proportion of NAV, write the single-event loss as . Give a sufficient condition under which one recall reduces NAV to zero or below, and explain how a positive recall probability then implies a positive probability of a single-event ruin. - Distinguish “negative geometric net growth, with long-run wealth tending to zero” from “hitting a liquidation or bankruptcy boundary within a finite horizon.” Explain why the latter also requires an explicit loss support or liquidation-threshold condition.
18. Solutions and Solution Hints
35-E01 Full Solution
-
Locate the error. In the first line,
cash_balance -= Q * fill_price, the definedfill_pricealready includes half-spreadand temporary impact . The account therefore pays the full purchase cost . The second and third lines deduct and again, double charging spread and market impact. -
Correct recursion:
-
Amount over-deducted: The error equals the sum of the second and third lines:
The erroneous code removes an extra USD 100.00 from the account.
35-E02 Full Solution
-
One-sided turnover for tradable risky securities
. The absolute stock-weight changes are 0.20 for asset 1, 0.20 for asset 2, and 0.10 for asset 3. Their sum is 0.50, so If the cash-weight change of 0.10 is included in a separately reported all-asset reallocation rate, the result is 0.30. That is a different statistic and cannot be used to infer stock traded notional.
-
Two-sided total traded notional in stocks. Only the stocks (assets 1, 2, and 3) trade in the market; cash is a passive settlement account. The sum of absolute stock-weight changes is
Thus two-sided stock traded notional is
-
Friction cost and basis points. The combined one-way friction rate is
. Total friction is In basis points of total portfolio assets (USD 5 million),
In other words, 25% one-sided stock turnover corresponds to 50% two-sided stock traded notional and cost erosion of 6.0 bps of the total portfolio.
35-E03 Full Solution
Given
-
Calculate each of the four terms.
-
Delay cost:
-
Execution friction:
-
Opportunity cost:
-
Explicit fee:
-
-
Total implementation shortfall and cross-check. The four terms sum to
Check with the direct-dollar method:
The two methods agree exactly.
35-E04 Full Solution
-
Stock-borrow fees. Calculate the fee security by security from short market value, borrow rate, and holding period:
The simple equal-weight average rate is 2.4%. Multiplying it by total short market value would give
, ten times the correct fee. The correct aggregate rate must be weighted by short market value and holding time; an unweighted average alone does not determine borrow cost. -
Financing interest. The negative cash borrowing balance is USD 2,000,000.00. At an annual financing rate of
, -
Total erosion:
In this constructed month, cash falls by USD 11,000. This result depends only on the constructed positions, rates, holding period, and
assumption in the problem.
35-P01 Reference Implementation
from typing import Dict, List, Any
import numpy as np
import pytest

def execution_ledger_step(
    cash_pre: float,
    positions_pre: Dict[str, float],
    orders: List[Dict[str, Any]],
) -> tuple[float, Dict[str, float]]:
    cash_post = cash_pre
    positions_post = positions_pre.copy()

    for order in orders:
        symbol = order["symbol"]
        qty = float(order["signed_qty"])
        mid = float(order["mid_price"])
        half_spread = float(order["half_spread"])
        impact_coef = float(order.get("impact_coef", 0.0))
        commission_per_share = float(order.get("commission_per_share", 0.0))

        if qty == 0.0:
            continue

        direction = np.sign(qty)
        impact = impact_coef * abs(qty)
        fill_price = mid + direction * (half_spread + impact)

        # Boundary and economic assertions.
        if direction > 0:
            assert fill_price >= mid, "A buy fill price must not be below the midpoint."
        else:
            assert fill_price <= mid, "A sell fill price must not be above the midpoint."

        commission = commission_per_share * abs(qty)

        # Correct accounting: do not deduct spread twice.
        cash_post -= (qty * fill_price + commission)
        positions_post[symbol] = positions_post.get(symbol, 0.0) + qty

    return cash_post, positions_post

# Automated test checks.
def test_anti_double_counting():
    cash_0 = 100_000.0
    pos_0 = {"A": 0.0}
    orders = [{
        "symbol": "A",
        "signed_qty": 1000.0,
        "mid_price": 50.0,
        "half_spread": 0.02,
        "impact_coef": 1e-4, # Impact = 0.10.
        "commission_per_share": 0.005
    }]
    cash_1, pos_1 = execution_ledger_step(cash_0, pos_0, orders)
    # fill_price = 50.0 + 0.02 + 0.10 = 50.12.
    # expected cash = 100000 - (1000 * 50.12 + 5) = 100000 - 50125 = 49875.0.
    assert np.isclose(cash_1, 49875.0, atol=1e-4)
    assert np.isclose(pos_1["A"], 1000.0, atol=1e-4)

    # An extra spread debit is the counterexample: it must fail the cash assertion.
    with pytest.raises(AssertionError):
        assert np.isclose(cash_1 - 1000.0 * 0.02, 49875.0, atol=1e-4)


def test_zero_fill_and_sell_side_boundary():
    cash_0 = 100_000.0
    pos_0 = {"A": 100.0}
    cash_1, pos_1 = execution_ledger_step(cash_0, pos_0, [{
        "symbol": "A", "signed_qty": 0.0, "mid_price": 50.0,
        "half_spread": 0.02, "commission_per_share": 0.01,
    }])
    assert cash_1 == cash_0 and pos_1 == pos_0

    cash_2, pos_2 = execution_ledger_step(cash_1, pos_1, [{
        "symbol": "A", "signed_qty": -10.0, "mid_price": 50.0,
        "half_spread": 0.02, "impact_coef": 1e-4,
        "commission_per_share": 0.005,
    }])
    assert cash_2 > cash_1 and pos_2["A"] == 90.0
35-P02 Reference Implementation
import numpy as np

def solve_purchasable_shares(
    cash: float,
    mid_price: float,
    half_spread: float,
    impact_coef: float,
    commission_per_share: float,
) -> tuple[int, float]:
    """
    Solve for the integer number of buy shares under trading frictions:
    F * (mid + half_spread + impact_coef * F) + commission * F <= cash
    Quadratic: impact_coef * F^2 + (mid + half_spread + commission) * F - cash = 0
    """
    values = (cash, mid_price, half_spread, impact_coef, commission_per_share)
    if not all(np.isfinite(value) for value in values):
        raise ValueError("All inputs must be finite.")
    if cash < 0 or mid_price <= 0 or half_spread < 0 or impact_coef < 0 or commission_per_share < 0:
        raise ValueError("Cash, price, or cost inputs are outside the allowed range.")
    if cash == 0:
        return 0, 0.0

    A = impact_coef
    B = mid_price + half_spread + commission_per_share
    C = cash

    if A == 0.0:
        # Linear limiting case.
        f_exact = C / B
    else:
        # Equivalent positive root; avoids subtracting nearly equal values for small impact coefficients.
        f_exact = 2 * C / (B + np.sqrt(B**2 + 4 * A * C))

    f_int = int(np.floor(f_exact))

    # Calculate actual cash used and residual cash.
    actual_fill_price = mid_price + half_spread + impact_coef * f_int
    cash_used = f_int * actual_fill_price + commission_per_share * f_int
    residual_cash = cash - cash_used

    assert residual_cash >= 0.0, "Actual outlay must not exceed available cash."
    return f_int, residual_cash
35-P03 Reference Implementation
import math
import numpy as np

def simulate_capacity_curve(
    alpha_gross: float,
    tau_period: float,
    fixed_cost_bps: float,
    impact_gamma: float,
    adv_market_per_day: float,
    trading_days_in_period: int = 252,
    n_points: int = 100,
) -> dict:
    values = (alpha_gross, tau_period, fixed_cost_bps, impact_gamma, adv_market_per_day)
    if not all(math.isfinite(x) for x in values):
        raise ValueError("all numeric inputs must be finite")
    if tau_period <= 0 or fixed_cost_bps < 0 or impact_gamma < 0:
        raise ValueError("return and cost inputs are outside their allowed range")
    if adv_market_per_day <= 0 or trading_days_in_period <= 0 or n_points < 2:
        raise ValueError("ADV and period lengths must be positive")

    aum = np.logspace(5, 8, n_points)
    traded_notional = 2 * tau_period * aum
    participation = traded_notional / (trading_days_in_period * adv_market_per_day)
    cost_per_traded_dollar = fixed_cost_bps * 1e-4 + impact_gamma * np.sqrt(participation)
    net_alpha = alpha_gross - (traded_notional / aum) * cost_per_traded_dollar
    dollar_profit = aum * net_alpha

    alpha_after_fixed = alpha_gross - 2 * tau_period * fixed_cost_bps * 1e-4
    k = impact_gamma * (2 * tau_period) ** 1.5 / math.sqrt(
        trading_days_in_period * adv_market_per_day
    )
    if alpha_after_fixed > 0 and k > 0:
        breakeven_aum = (alpha_after_fixed / k) ** 2
        optimal_aum = 4 * breakeven_aum / 9
    else:
        breakeven_aum = None
        optimal_aum = None

    return {
        "aum": aum,
        "net_alpha": net_alpha,
        "dollar_profit": dollar_profit,
        "breakeven_aum": breakeven_aum,
        "optimal_aum": optimal_aum,
    }

# Constructed monthly example from section 8.8, expressed with its 21-day horizon.
r = simulate_capacity_curve(0.012, 1.0, 8.25, 0.05, 100_000_000, 21)
assert abs(r["breakeven_aum"] - 11_247_862.5) < 1.0
assert abs(r["optimal_aum"] - 4_999_050.0) < 1.0
assert simulate_capacity_curve(-0.01, 1.0, 0.0, 0.05, 100_000_000, 21)["breakeven_aum"] is None
assert simulate_capacity_curve(0.012, 1.0, 0.0, 0.0, 100_000_000, 21)["optimal_aum"] is None
The function returns an analytic break-even scale of about USD 11.25 million and a maximum net-dollar-return scale of about USD 5.00 million under the monthly teaching parameters. Recalculate for other inputs; do not carry these values over.
35-C01 Open-Challenge Argument and Grading Rubric
-
Construct the total-cost function. In
discrete slots, the quantity traded per slot is . Temporary impact per share in each slot is . The impact outlay in one slot is Total temporary-impact dollars across
slots are The total execution-cost function is
-
Analytic solution for linear impact (
). When , . The first-order condition is giving
The second derivative is
, so the objective is strictly convex on the continuous domain , and its continuous critical point is the unique global minimum. The actual number of slots must be an integer . If , choose ; otherwise compare the costs at the feasible adjacent integers and . This solution applies only to the stated construction with per-slot liquidity resets and an exogenous penalty; it is not a general theorem for execution over a fixed duration. -
Extremum for square-root impact (
). When , . The first-order condition is The critical point is
The second derivative is
, again making the continuous objective strictly convex. The discrete choice still respects the feasible boundary and compares costs at adjacent integers. This analytic curve describes only the stated exogenous-penalty and per-slot-reset assumptions.
Grading rubric (100 points):
- Correctly construct
and identify the dimensional conversion from per-slot impact to total impact dollars (30 points). - Derive the linear-impact optimizer, verify second-order convexity, and explain the economic intuition (30 points).
- Solve the square-root-impact first-order condition and verify the second-order sufficient condition (25 points).
- Apply the discrete integer constraint and explain how to choose between rounding down and up in practice (15 points).
35-C02 Reference Argument and Grading Rubric
-
Let the high-spread-state indicator be
and the recall indicator be , independent of each other and of gross return. Under the problem's cost definition, Therefore,
or 7.94%. The variance is
The standard deviation is about 9.1122%, and the net Sharpe is approximately
. A gross Sharpe of 1.5 alone does not determine net Sharpe; this decline follows from the numerical assumptions in this problem. -
If a recall event's loss as a fraction of NAV is
, a value of at least 1 means that a single price jump in this model can exhaust all NAV. If the event probability , then the probability of at least one event over a finite horizon is positive. Under the simplifying assumption of independent events with a fixed annual probability, the probability over years is . Real margin-liquidation thresholds may be above zero NAV, and actual jump and impact distributions require data estimation. -
If one event cannot exhaust NAV, but positive-NAV returns are independent and identically distributed, satisfy
, and have an integrable logarithm, long-run geometric wealth tends to zero almost surely by the law of large numbers. The second-order approximation should be used only for small return magnitudes and when returns remain well above
; it is not equivalent to bankruptcy within a finite horizon.
Grading rubric (100 points): Correct mean, variance, and Sharpe calculations (35 points); derivation of single-recall NAV loss and the positive-event-probability condition (35 points); correct distinction between negative geometric growth and finite-horizon liquidation (20 points); explanation of independence and constructed-parameter boundaries (10 points).
19. Further Reading
To build a complete academic and industry understanding of transaction costs, market microstructure, and algorithmic execution, read the following sources in sequence.
- Must Know
- Perold, A. F. (1988). The Implementation Shortfall: Paper vs. Reality. The Journal of Portfolio Management, 14(3), 4–9. JPM publisher record.
- Why read it: A bibliographic lead related to implementation shortfall. The 2026-10-09 source review checked publisher and author bibliographic metadata only; it did not read the paper's text. This chapter does not rely on this entry for a specific definition, formula, or priority claim. This batch carried forward that historical status without a new search or full-text review.
- Almgren, R., & Chriss, N. (2000). Optimal Execution of Portfolio Transactions. Journal of Risk, 3(2), 5–39.
- Why read it: A classic foundation for algorithmic execution and impact modeling. Read Sections 1–3 on the physical decomposition of temporary and permanent impact and the derivation of a discrete-time mean-variance optimal execution trajectory.
- Perold, A. F. (1988). The Implementation Shortfall: Paper vs. Reality. The Journal of Portfolio Management, 14(3), 4–9. JPM publisher record.
- Should Know
- Frazzini, A., Israel, R., & Moskowitz, T. J. (2012). Trading Costs of Asset Pricing Anomalies. AQR Working Paper.
- Why read it: A representative industry study using institutional order data to compare actual execution costs with hypothetical spread estimates in CRSP data. Read its empirical methods and the differences between the two estimates.
- Huberman, G., & Stanzl, W. (2004). Price Manipulation and Quasi-Arbitrage. Econometrica, 72(4), 1247–1275. DOI.
- Why read it: Under its assumptions about time-independent price updates and the market, the paper discusses the form of permanent impact needed to exclude quasi-arbitrage. Its result cannot be generalized beyond the model conditions as a universal empirical law.
- Frazzini, A., Israel, R., & Moskowitz, T. J. (2012). Trading Costs of Asset Pricing Anomalies. AQR Working Paper.
- Advanced
- Bouchaud, J.-P., Gefen, Y., Potters, M., & Wyart, M. (2004). Fluctuations and Response in Financial Markets: The Subtle Nature of “Random” Price Changes. Quantitative Finance, 4(2), 176–194.
- Why read it: Optional follow-up reading for a later source review. The current source record does not include a review of this paper, so no summary of its derivations is provided here. This chapter does not rely on it for claims about square-root impact or decay kernels.
- Bouchaud, J.-P., Gefen, Y., Potters, M., & Wyart, M. (2004). Fluctuations and Response in Financial Markets: The Subtle Nature of “Random” Price Changes. Quantitative Finance, 4(2), 176–194.
- Optional
- U.S. Securities and Exchange Commission (SEC) (2020). Staff Report on Algorithmic Trading in U.S. Capital Markets.
- Why read it: For background on order routing, market-maker internalization, and dark-pool execution in today's fragmented, multi-venue markets.
- U.S. Securities and Exchange Commission (SEC) (2020). Staff Report on Algorithmic Trading in U.S. Capital Markets.
20. References
The core references cited in this chapter and the specific claims they support are bounded as follows:
PEROLD_1988: Perold, A. F. (1988), “The Implementation Shortfall: Paper vs. Reality,” The Journal of Portfolio Management, 14(3), 4–9. JPM publisher record.- Supported claim: The 2026-10-09 source review checked the HBS author page and publisher bibliographic record, supporting only the author's name, title, and publication details. The full paper was not read; this entry does not support the specific definition or formula in Section 6.2 or a priority claim.
AQR_COST: Frazzini, A., Israel, R., & Moskowitz, T. J. (2012), Trading Costs of Asset Pricing Anomalies, AQR Capital Management Working Paper. URL.- Supported claim: Provides context in Section 11 about institutional trade data at scale (1998–2011, 19 developed markets, and close to USD 1 trillion of executions) and differences from estimates in academic models. Its parameters must not be applied directly as constructed inputs for this chapter.
ALMGREN_CHRISS_2000: Almgren, R., & Chriss, N., Optimal Execution of Portfolio Transactions, Journal of Risk, 3(2), 5–39 (2000). DOI: 10.21314/JOR.2001.041.- Supported claim: Supports the classic mathematical definition and modeling framework in Sections 5.4 and 6.1 that separates temporary impact (which erodes the immediate fill price) from permanent impact (which shifts the midpoint).
SEC_IS_2003: U.S. Securities and Exchange Commission, Request for Comments on Measures To Improve Disclosure of Mutual Fund Transaction Costs, Release Nos. 33-8349, 34-48952, IC-26313 (2003). URL.- Supported claim: Supports the historical regulatory context in Sections 5.3 and 11.1 linking implementation shortfall to the paper portfolio, and the historical statement that the SEC said in 2003 there was no universally accepted method for portfolio implementation shortfall. It does not support claims about current universal formulas or every regulatory regime.
CESARI_MARZO_ZAGAGLIA_2012: Cesari, R., Marzo, M., & Zagaglia, P., Effective Trade Execution, arXiv:1206.5324 [q-fin.TR] (2012). URL.- Supported claim: Supports cross-checking the terminology in Sections 5 and 14 for execution frictions, TWAP/VWAP scheduling benchmarks, and implementation-shortfall classifications. It is background literature, not the sole implementation standard for an industry.
SEC_ALGO: U.S. Securities and Exchange Commission, Staff Report on Algorithmic Trading in U.S. Capital Markets (2020). URL.- Supported claim: Supports the summary in Section 11.1 of multi-venue market structure, the effects of algorithmic trading, changes in several market-quality and liquidity measures under normal conditions, and risks during stress or volatility. It does not support a general claim about spread, depth, or cost differences between large-cap and micro-cap stocks.
HUBERMAN_STANZL_2004: Huberman, G., & Stanzl, W., Price Manipulation and Quasi-Arbitrage, Econometrica, 72(4), 1247–1275 (2004). DOI.- Supported claim: Used only for the model-boundary note in Section 5.4: under time-independent price updates, absence of quasi-arbitrage, and independent temporary and permanent components, only the permanent-update component is required to be linear. This is not a universal empirical law.