CHAPTER 16/ 45
Time Series I: Dependence and ARIMA
Roadmap: First explain how a series depends on its past over time, then estimate a model that uses only past information and evaluate it with forecasts that advance strictly in time.
Prerequisites: Chapters 6 on probability, 7 on statistics, 8 on regression, and 11 on returns and performance measures. By the end, you will be able to distinguish price levels from returns; define weak and strict stationarity; explain the difference between white noise and IID; calculate the mean, variance, and autocorrelation of an AR(1) by hand; read ACF/PACF plots; compare AR, MA, ARMA, and ARIMA models; diagnose residuals; calculate prediction intervals; and write a month-by-month expanding-window forecast.
1. Learning Objectives
By the end of this chapter, you should be able to do five things:
- Treat a time index with a stated frequency as part of the data; identify missing months, unsorted observations, and missing values; and refuse to compress time into row numbers with no gaps.
- State weak-stationarity conditions from finite means, variances, and autocovariances, and explain how they relate to strict stationarity, white noise, and independent and identically distributed observations.
- Derive the stationary mean, variance, autocovariance, ACF, and multi-step forecast-error variance from the recursion
. - Use the lag operator to explain AR, MA, ARMA, and ARIMA models; understand that ACF/PACF patterns are clues for candidate models, not automatic model selectors.
- Restrict model-order and parameter choices to the training window, use only observations available before each forecast origin, and compare forecasts with a naive benchmark.
State mathematical units consistently: monthly returns are decimals, so 0.01 means a 1% return for that month; means and forecasts are also in monthly-return decimals; variances are in squared return decimals; ACF and PACF are dimensionless; and lag
2. Why Quants Need This
A time-series model turns the question “Does the recent value contain information about the next period?” into a question that can be stated and tested. In quantitative work, this often comes after data cleaning and before regression or strategy testing: first choose the target variable (a price, return, spread, or volatility proxy), describe how it depends on its own history, and then ask whether that relationship would have been available at the forecast time.
Storing daily, monthly, or quarterly data as a column of numbers discards the spacing between observations. If an asset has no observation for March 2024, applying dropna() and treating February and April as adjacent steps no longer makes an AR(1) a “one-month lag.” Modeling a cumulative price level as though it were a stationary return can make a trend look like strong correlation. If you choose an order using the full data and then call the second half an out-of-sample forecast, the future has already influenced the research decision.
The chapter follows a complete chain: define the observation clock → calculate autocovariance and correlation → represent dependence with a low-order model → estimate from training data → inspect what the model leaves behind → forecast forward one period at a time → compare with a naive benchmark. The time index is not decoration; it determines the meaning of a lag and the forecast target.
3. Intuition
Imagine two “monthly-return machines.” Both have a long-run average monthly return of 0.5% and a long-run one-month standard deviation of 4%. The first draws a new independent card each month. The second carries forward 70% of the previous month's deviation from its long-run mean. Their averages and volatility alone do not distinguish them; if the second machine was above average last month, it is more likely to be above average this month too. The difference lies in the ordering over time.
This kind of “memory” is described by autocorrelation. Positive lag-1 autocorrelation means neighboring months usually deviate from the mean in the same direction; a negative value means they tend to move in opposite directions. A value near zero says only that linear correlation is small; it does not rule out nonlinear dependence, volatility clustering, or common external shocks.
A common misconception is that a return series that fluctuates smoothly around a level proves that its data-generating process is stationary. A structural break, a few extreme months, or a slow stochastic trend can all mislead a finite-sample plot. A plot raises a question; theoretical assumptions and later tests provide different kinds of evidence.
3.1 A Stochastic Process Is Not a Single Line
A stochastic process is a time-indexed family of random variables
| Possible world | January return | February return | March return |
|---|---|---|---|
| A (the path actually observed) | 1% | −1% | 2% |
| B | −1% | 2% | 0% |
| C | 0% | 1% | −2% |
The January column corresponds to the random variable
The population parameters of the two return machines can be written in one table. Let
| Population quantity | IID machine | AR(1) machine, |
|---|---|---|
| Long-run mean | 0.005 | 0.005 |
| One-month variance | 0.0016 | 0.0016 |
| Innovation standard deviation | 0.04 | |
| Lag-1 covariance | 0 | |
| Lag-2 correlation | 0 |
Equal marginal means and variances do not determine how neighboring months move together. The AR machine needs a smaller innovation variance because past shocks also contribute to the current month's total variation. Sample values in a finite data table will not exactly match these population parameters.
4. Mathematical Foundations
Let
If prices are quoted in euros,
This chapter represents calendar months with a monthly PeriodIndex. The lag from 2024-02 to 2024-03 is one month even when the two calendar months have different numbers of days; this does not assume February and March have the same number of days. A missing month is a missing observation, not an excuse to treat “the next CSV row that remains” as a one-month lag. The core code requires consecutive months and rejects NaN, positive or negative infinity, and complex inputs; it does not fill values automatically.
For a stationary series with finite variance, its mean, variance, and autocovariance are:
Here,
5. Formal Definitions
Strict stationarity requires that, for every positive integer
Weak stationarity (also called covariance stationarity) requires finite second moments, a mean that does not vary with
White noise (WN) uses a second-order definition in this chapter:
The autocorrelation function (ACF) lists how
For observations
Here
An autoregressive model (
The lag operator
A prediction interval, conditional on a model and information set, gives an uncertainty range for one future observation. It is wider than a confidence interval for the conditional mean because the future innovation also varies. With normal errors, parameters treated as known, and forecast variance
Here
6. Derivations
6.1 AR(1): From the Recursion to Stationary Moments
Start with an AR(1) with an intercept:
Under the causal stationarity condition
Centering separates the long-run level from variation around it; here
In the causal setup used here, the innovation is a new shock in the current period and is uncorrelated with the past. For the shock weights
Next, multiply
Repeated application of the recursion gives
If
When
The remainder after a finite expansion is
6.1.1 A Stable Recursion and a Stationary Initialization Are Different Things
Assume the future innovations are independent of
The first term comes from the starting value; the second comes from innovations that have entered the process. A fixed starting value has variance zero. Let
| Mean | Variance from a fixed start | Variance from stationary initialization | |
|---|---|---|---|
| 0 | 0.005 | 0 | 0.0048 |
| 1 | 0.005 | 0.0036 | 0.0048 |
| 2 | 0.005 | 0.0045 | 0.0048 |
| 3 | 0.005 | 0.004725 | 0.0048 |
The means are equal, but the variance changes over time, so the process initialized at the left is not weakly stationary. If
6.2 How Multi-Step Forecast Errors Widen
To derive the conditional forecast mean and forecast-error variance, assume that future innovations are independent and identically distributed, and that the entire set of future innovations is independent of the information available at the forecast origin; innovations have mean zero and variance
The value
For an
Under these assumptions, conditional on
Here
How the Information Set Changes the “Best” Forecast
The conditional mean is the optimal forecast under squared-error loss, given
Given the past value
6.3 MA(1), Invertibility, and ARMA
First distinguish two objects both called a moving average. The rolling price mean
Use the MA(1) sign convention
The lag-0 variance adds the variances of the two terms because
The theoretical ACF of an MA(1) is zero from lag 2 onward, while the PACF generally decays gradually. If
Because
The PACF of
6.4 Differencing and Over-Differencing
First differencing is defined by
From input to output, first differencing subtracts last month's level from this month's level and drops the first month, which cannot be paired. For example, for month-end prices
Differencing can remove a stochastic trend, but it also loses the first sample row and changes the question. If the original monthly series is already white noise,
This is the boundary case of an MA(1) with
6.5 Returning a Differenced Forecast to the Original Quantity
If a model forecasts
The last observed price is 102 euros per share, and the predicted changes for the next two months are 1 and 2 euros per share, giving level forecasts of 103 and 105. If the two change-forecast errors
Log prices add another complication: if forecast_arima returns a forecast of whichever series it receives; if the original level is passed with
6.6 How Long Is One Lag?
The population ACF/PACF objects were defined in Section 5; sample estimates suggest candidates, while out-of-sample errors show how a candidate forecasts the next period. Both depend on a valid observation clock: month labels use calendar time, trading-day numbers use trading time, and transaction numbers use event time. One step of a transaction-level AR(1) means the next transaction, which may occur milliseconds or hours later; it is not automatically a one-minute forecast. For a one-minute forecast, first define a one-minute grid and specify what a no-trade interval means.
In the missing-month example, February to April is two steps. Given the February state, the April conditional-mean deviation in the same AR(1) model is multiplied by
7. Financial Interpretation
When modeling an asset price
If monthly returns follow a stable AR(1), a positive
Linear return autocorrelation and volatility clustering are separate issues. Even when the return ACF is near zero,
Tradable timing cannot be inferred from a month label alone. If available_at, signal signal_time, the earliest executable trade_time, and the target return interval. French monthly portfolio files do not report historical release times month by month, so they describe the published historical series but do not provide a point-in-time training set.
8. Numerical Example
Now consider an MA(1) with
Finally, compare the two constructed return machines with common mean 0.005 and marginal standard deviation 0.04. Every nonzero-lag population ACF of the IID machine is zero. Set the AR(1) machine to
9. Python Implementation
Default Entry Point for This Reader Edition
From the accepted I3 reader package root, create an independent environment using its environment instructions, then run:
.venv/bin/python run_notebook.py notebooks/ch16_time_series.ipynb
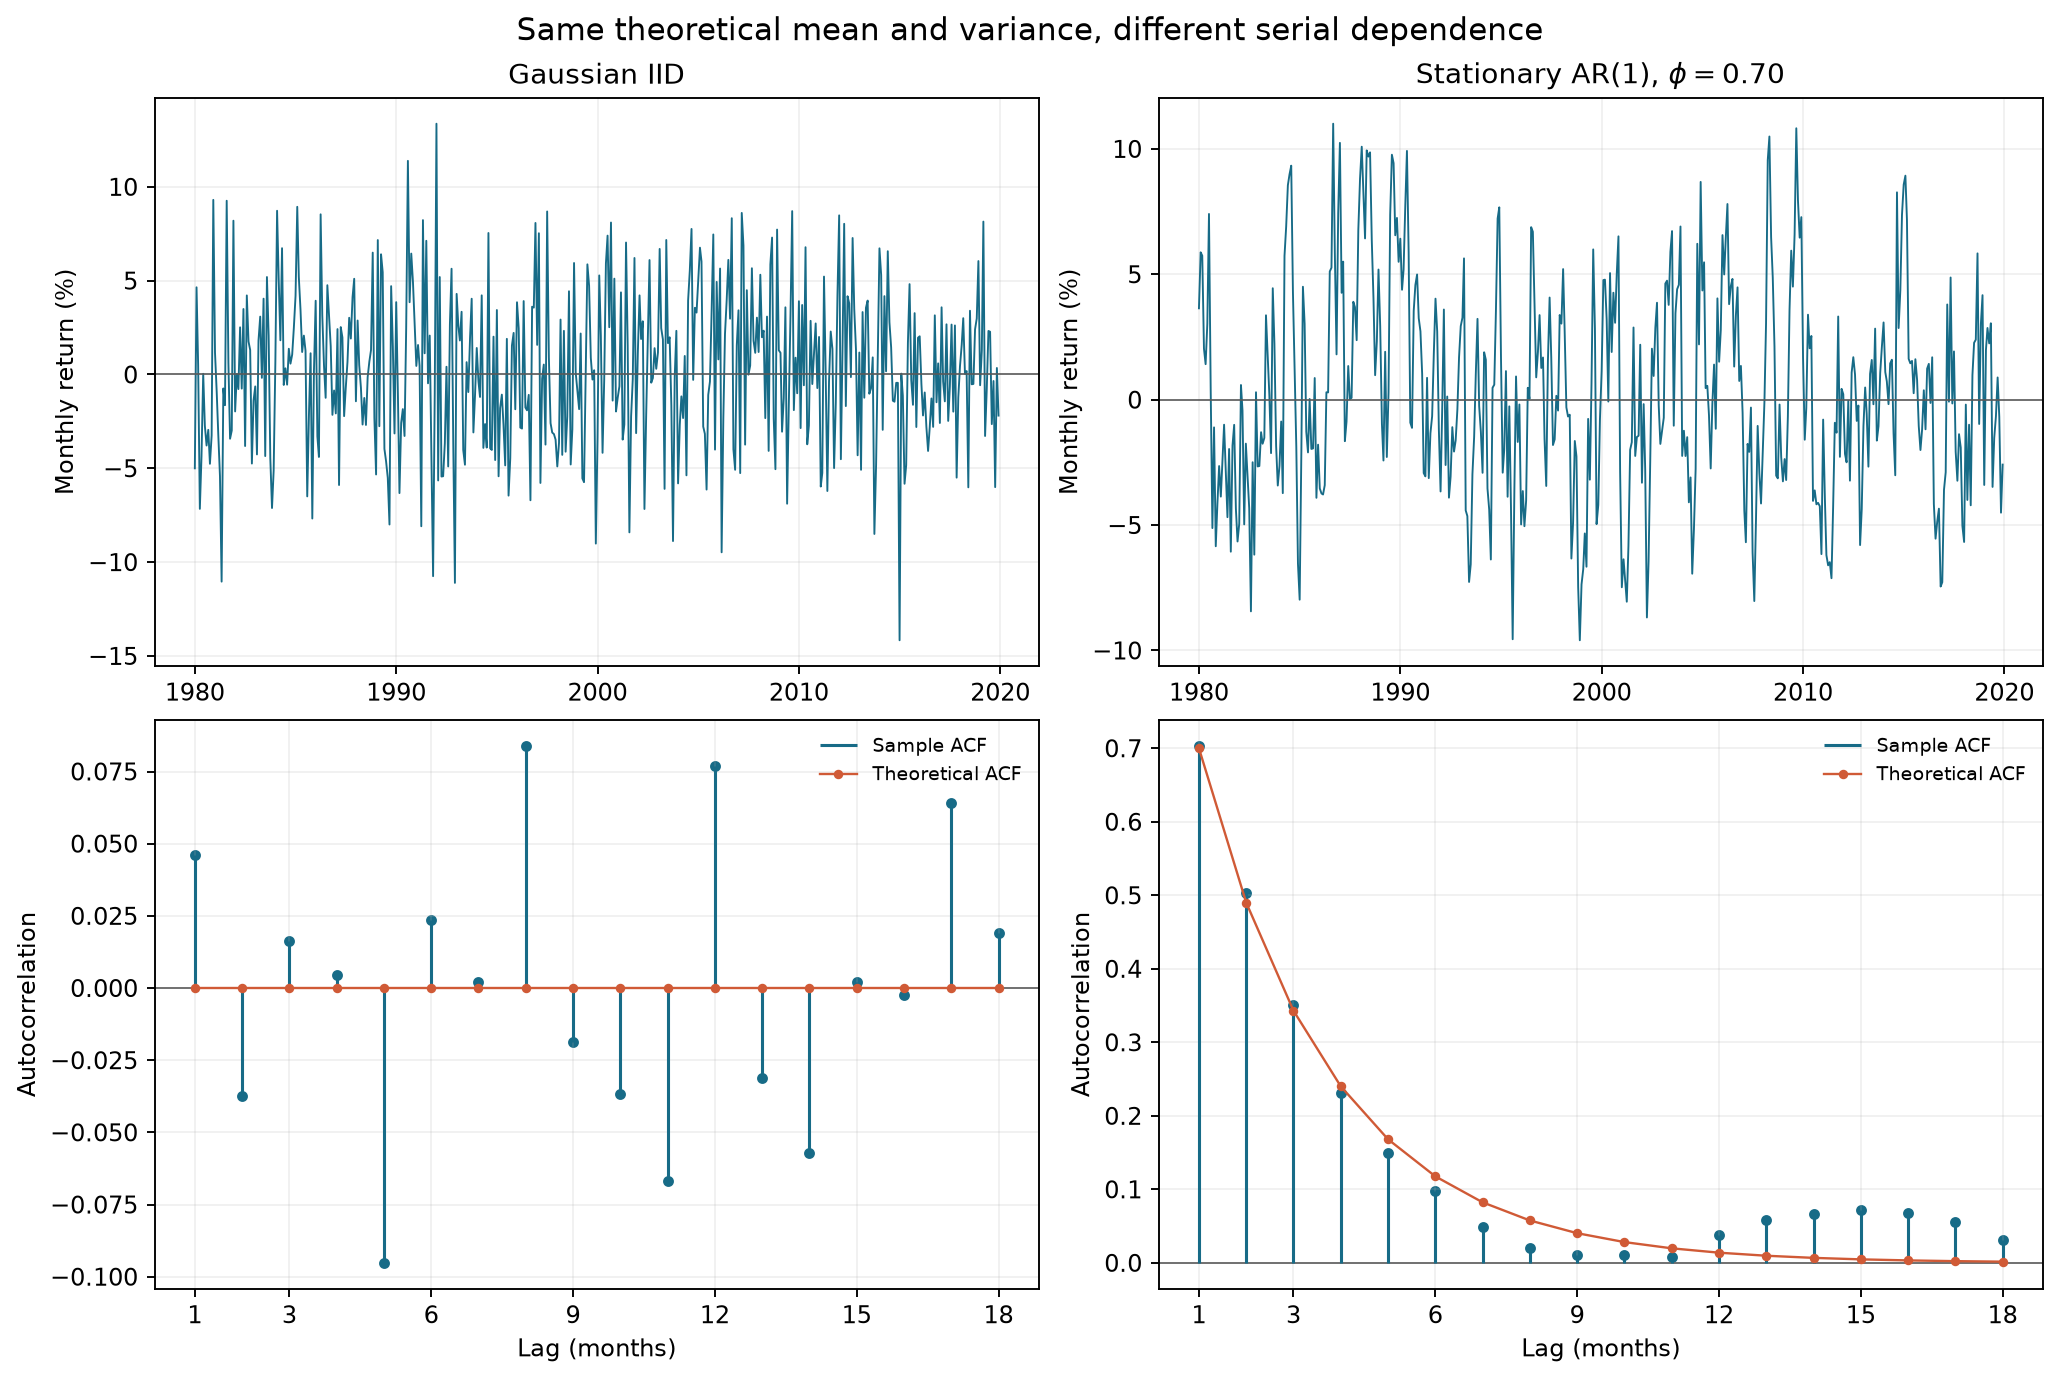
With seed 20261016, the default run constructs 480 months of IID and AR(1) returns from 1980-01, with mean 0.005, marginal standard deviation 0.04, and AR coefficient 0.7. The AR starting value is drawn from its stationary normal distribution; the innovation standard deviation is 0.04 times sqrt(1−0.7²). It checks theoretical moments and sample ACF/PACF, then trains on the first 360 months through 2009-12 and forecasts three months starting in 2010-01. Training residuals receive a Ljung–Box check with lag=12 and model_df=1. Over the final 120 months, expanding-window one-step ARIMA forecasts are compared with the mean available from each training window using RMSE.
The Notebook displays the existing bundled figure fixtures/figures/a4/ch16_stationarity_acf.png; displaying it does not regenerate it. RUN_FRENCH=False disables the historical market branch. Although it creates and prints runs/ch16_time_series_<uuid>/, this Notebook writes no CSV or PNG there. The runner separately saves the executed copy and status in a unique runs/execution_* directory; these directories serve different purposes. Constructed calculations are not evidence of market predictability or strategy net returns. The historical French figures and numbers in Sections 10–11 retain their original status.
The CLI and production tests below belong to the historical course working-root workflow and are not this package's default route. Readers need not restore production tests that are absent from the package. The I3 Chapter 16 CLI still reads French data unconditionally; the Chapter 17 CLI's historical branch requires --french-data. Neither replaces the default command above.
Historical Course Working Root and Original Implementation
The core implementation for this chapter is in time_series.py. validate_monthly_series requires a sorted, unique, consecutive PeriodIndex(freq="M") with finite real values; it explicitly rejects missing months, NaN, infinity, and complex numbers. split_monthly_series splits by row count into earlier and later observations without shuffling. forecast_arima(train, ...) receives only the training prefix; rolling_origin_forecast refits an expanding window before each target month and forecasts the next month. This teaching wrapper supports only nonseasonal differencing orders
The statsmodels ARIMA likelihood implementation may issue numerical-convergence warnings for very small decimal returns. The fitting function in this chapter multiplies monthly return decimals by 100 to fit in percentage points, then scales forecast means, intervals, and residuals back to decimals; AR/MA coefficients do not change under this uniform linear scaling. FittedARIMA.result is the fitted statsmodels result in percentage-point units. Its intercept, residuals, and innovation standard deviation remain in percentage points if read directly; use .residuals to obtain residuals in decimals.
For estimation, the input is a monthly-return series ending at the forecast origin, and the model order fit() estimates parameters on that training sample; only then does get_forecast() produce future conditional means and prediction intervals. ACF/PACF help narrow the candidates. AIC/BIC can compare fitted candidates within the training window, followed by MAE/RMSE comparisons on a time-ordered validation window; the final holdout must not be used for repeated order selection.
For trend="c". Statsmodels treats the trend term as a regression constant, so const here denotes the constant level or unconditional mean of the series. In the textbook recursion with intercept const as the recursion's trend="n", with no drift term estimated. The model also constrains AR roots to be stationary and MA roots to be invertible, and it raises an error for missing values. These computational settings do not prove that the data satisfy the model. Standard prediction intervals depend on the innovation structure; normal intervals also depend on a normal-error approximation, and parameter uncertainty is not automatically included when parameters have been estimated.
From the quant_course/ project root, run the script and the focused tests:
.venv/bin/python code/ch16_time_series.py
.venv/bin/python -m pytest -q tests/test_ch16_time_series.py
The script uses fixed seed 20261016 to generate 480 months of constructed IID and AR(1) data, plots them, prints theoretical and sample moments and expanding-window simulation RMSE, and reads the French industry snapshot for descriptive statistics. The notebook ch16_time_series.ipynb must be rerun from its first cell using the quant-course-venv kernel. The notebook calls src/ directly rather than reimplementing the core functions.
The following is a complete monthly split and one-step forecast example. Return decimals represent monthly returns; target_period is the target month of a forecast, not the actual trade_time.
import numpy as np

from quant_course.time_series import (
    forecast_arima,
    simulate_stationary_pair,
    split_monthly_series,
    training_mean_forecast,
)

monthly_returns = simulate_stationary_pair(
    n=120, seed=20261016, mean=0.005, marginal_sd=0.04, phi=0.7
)["ar1"]
train, test = split_monthly_series(monthly_returns, train_size=96)
prediction = forecast_arima(train, steps=1, order=(1, 0, 0))
baseline = training_mean_forecast(train, steps=1)
print("train through:", train.index[-1], "target:", prediction.index[0])
print("ARIMA forecast:", float(prediction.iloc[0]["forecast"]))
print("training-mean baseline:", float(baseline.iloc[0]))
print("realized test return, for retrospective scoring only:", float(test.iloc[0]))
assert prediction.index[0] == test.index[0]
assert np.isfinite(prediction.to_numpy()).all()
For sample ACF/PACF, sample_acf_pacf explicitly returns lags 1 through adjusted=False, fft=False, missing="raise" and PACF setting method="ywadjusted". Finite-sample ACF/PACF confidence bounds depend on additional assumptions; crossing a line in the chapter's plot is not treated as proof of a model.
10. Visualization
The figure below shows 480 months of simulated data generated by the script with seed 20261016. The top row has monthly observation time on the horizontal axis and monthly return in percentage points on the vertical axis. The bottom row has lag in months horizontally and dimensionless ACF vertically. Blue shows the sample ACF; orange shows the population ACF implied by the generating parameters. The IID process has an orange line at zero, while the AR(1) population correlation decays as
11. Real Market Example
The local real-data sample is the current monthly value-weighted return cache for the French 10 industry portfolios, monthly industry-return CSV, with the original source at the data details page and the saved data manifest. The cache was parsed from a ZIP downloaded on 2026-10-05, selecting the “Average Value Weighted Returns — Monthly” block and dividing source percentages by 100. It contains 1,202 months, from 1926-07 through 2026-08. These are published industry-portfolio returns, not single-stock OHLCV prices or fund execution returns.
The script reads the NoDur column (consumer nondurables) and obtains a mean of 0.009411, sample standard deviation 0.045564, sample ACF(1)=0.094385, and ACF(12)=0.034820. These numbers confirm that the fields, units, and descriptive calculations ran; they do not show significance, stability, predictable returns, or strategy effectiveness. Monthly returns are not a sample whose homoskedastic IID properties are guaranteed by construction. The A1 manifest also says this cache is the current published version and cannot reconstruct the version visible in each historical month, so it cannot support a claim of a genuine historical rolling forecast.
The parsing rule preserves month as a YYYYMM string and then converts it to PeriodIndex(freq="M"); every industry column contains simple monthly returns in decimals. The data have no daily OHLCV block, so they cannot be converted into daily observations. The manifest has not verified a general license for redistribution outside the course; public download does not automatically permit unrestricted forwarding.
12. Common Mistakes
Treating month-end DatetimeIndex values as equally spaced days. February 29 to March 31 and March 31 to April 30 are both one observation month even though the number of calendar days differs. Use a monthly PeriodIndex for monthly series. If the task depends on actual days or business days, explicitly define a different time scale instead of guessing from row numbers.
Dropping missing months before calculating lags. Applying dropna() makes the remaining rows adjacent, so the model cannot see that the observations are two months apart. This chapter rejects gaps and missing values. To address one, return to the source, determine what the missingness means, and define an appropriate method; do not automatically fill with zero, forward-fill, or pretend the observations are equally spaced.
import numpy as np
import pandas as pd

from quant_course.time_series import validate_monthly_series

incomplete = pd.Series(
    [0.01, -0.02],
    index=pd.PeriodIndex(["2024-01", "2024-03"], freq="M"),
    name="monthly_return",
)
try:
    validate_monthly_series(incomplete)
except ValueError as error:
    print(type(error).__name__ + ":", error)
Confusing price levels with returns. For prices 100, 110, and 121, the price autocorrelation is usually high because the previous price enters the current price directly, while the simple returns are 10% and 10%. Even a good AR(1) fit to prices does not show that returns have the same predictive relationship. When needed, calculate returns for the stated research target and define the return interval separately.
Choosing an order because the ACF/PACF “cuts off.” Sample correlations are estimates, and random spikes are likely somewhere among dozens of lags. A low-order plot pattern only suggests candidates. Select orders within the training window, then compare forecast loss on a time-ordered validation window. Do not repeatedly change
Choosing transformations or estimating preprocessing on the full sample before splitting. A fixed causal backward difference, applied only to observations available at each origin, does not by itself use future information. Leakage can arise when full-sample decisions choose whether or how to transform, fit an estimated preprocessing step, impute values, or otherwise bring future information into past modeling decisions. Define the raw data with its availability times first; align training and validation cutoffs with forecast origins; fit each estimated transformation using training data only.
Calling a large Ljung–Box p-value “independent residuals.” The test checks a set of linear autocorrelations for a selected lag set and asymptotic reference distribution. Small-sample power is limited, and it does not check autocorrelation in squared residuals, heavy tails, or parameter stability. Report the test's
Starting from residual sample
The null hypothesis is that the population residual autocorrelations at these lags are jointly zero. Under the usual asymptotic calibration, the reference degrees of freedom are model_df (for an ARMA fit, this usually subtracts the number of estimated AR and MA parameters). For example, when
import pandas as pd

from quant_course.time_series import ljung_box_diagnostic, simulate_stationary_pair

residuals = simulate_stationary_pair(n=120, seed=20261016)["iid"]
diagnostic = ljung_box_diagnostic(residuals, model_df=1, lag=12)
print(diagnostic.to_string())
print("Interpretation: a failure to reject is not proof of IID residuals.")
13. Quant Research Application
First narrow the research question to: “Do past monthly returns improve the point forecast for next month's return?” This is neither “Does AR(1) prove a causal momentum mechanism?” nor “Can we trade at no cost?” A complete design can follow these steps:
- Define the variable and clock. Record the source, currency, frequency, adjustment/dividend convention, and monthly interval for the price or portfolio return. If a feature
uses data that are not complete until the end of month , its available_atcannot precede the actual release time. Setsignal_timeonly after all inputs are visible;trade_timemust follow the signal and comply with the selected market's execution rules. Define targetas the next month's return interval, not the same-period . - Describe the data; do not infer stationarity from a plot. Inspect separate plots of price levels and returns, missing months, outliers, distributions, and ACF/PACF. One step in a monthly PeriodIndex is one month; empirical returns are not necessarily stationary. This chapter does not perform unit-root or cointegration tests; those are covered in Chapter 17.
- Set training and validation windows in advance. For example, train on the first 15 years and forecast one month at a time afterward; at each origin, refit parameters using only observations available before that origin. Choose orders and bandwidths within the training range and reserve the final period for one final validation. If the input source has no verifiable historical release time or version, downgrade the result to “descriptive analysis of the current snapshot”; do not call it a point-in-time backtest.
- Compare with naive benchmarks. For returns near zero, the training mean or a zero-return forecast are clear candidates. At each origin, calculate the training mean using only earlier observations. Compute MAE/RMSE in target-return decimals and compare errors for the same forecast months. Retain the result if ARIMA does not consistently beat the benchmark.
- Diagnose and seek disconfirming evidence. Check residual linear autocorrelation, distributional anomalies, parameter changes across windows, and errors across volatility regimes. Test sensitivity to prespecified model orders and forecast origins. If signal timing is invalid, forecast error does not beat the benchmark, improvement appears only in one period, or residuals/parameters show model failure, do not package correlation as predictable alpha.
At each step, the rolling function receives only the prefix observed earlier. It demonstrates data-access rules; it does not construct historical available_at or execute trades for you. The current French monthly-return snapshot lacks month-by-month historical ingestion/release times and therefore cannot support a valid historical point-in-time forecast experiment.
14. Chapter Summary
Define the time step, return target, and index first; only then does a lag have economic meaning. Stationarity describes whether distributional or moment structure changes over time; white noise describes second-order correlation; ACF/PACF summarize linear relationships across lags. AR, MA, ARMA, and ARIMA models parameterize these relationships but do not automatically identify an economic mechanism.
AR(1) shows the chapter's central chain:
15. Exercises
All questions are answered in Section 18 of this chapter. Unless stated otherwise,
16-E01 (Concept). Distinguish strict and weak stationarity mathematically. Explain why strict stationarity implies weak stationarity when second moments are finite, then outline a construction that is weakly but not strictly stationary.
16-E02 (Concept). Is “white noise is IID” correct? Construct a process with mean zero, variance 1, zero autocovariance at every nonzero lag, and dependence; identify observable evidence of the dependence.
16-E03 (Concept). How do the typical population ACF/PACF patterns help distinguish AR(1), MA(1), and ARMA(1,1)? Explain why these patterns alone cannot determine the order.
16-E04 (Time axis). A CSV contains three monthly returns dated 2024-01, 2024-02, 2024-04. After dropping missing rows and applying shift(1), how many months apart are the second and third observations? How should time be represented and the gap handled?
16-E05 (Concept). Why does a price chart that keeps rising prove neither a unit root nor that monthly returns are unpredictable? Which question is left to Chapter 17?
16-E06 (Forecasting). How do the targets of a prediction interval and a confidence interval for the conditional mean differ? What uncertainties and distributional assumptions still need checking when using a normal AR(1) interval?
16-E07 (By hand: AR(1) moments).
16-E08 (By hand: forecasting). For the process in E07, if this month is
16-E09 (By hand: MA(1)).
16-E10 (By hand: differencing). If
16-P01 (Programming). Generate two simulated 240-month series with a fixed seed. Calculate the AR(1) ACF/PACF through lag 12 and print the first lag and sample size. Then assert that strict validation rejects a sample with a missing month.
16-P02 (Programming). For a fixed-seed 240-month AR(1) simulation, train on the first 180 months and forecast the next month. Print the target month, ARIMA forecast, training-mean benchmark, and realized test value. Assert that the forecast index equals the first test month; do not pass the realized test value to the fitting function.
16-P03 (Programming). Fit ARIMA(1,0,0) to the P02 training data, run a lag-12 Ljung–Box test on training residuals, and print the test statistic, p-value, and degrees of freedom. In one sentence, state the null and what the test cannot prove.
16-C01 (Challenge: same moments, different autocorrelation). Construct monthly IID and AR(1) series with the same theoretical mean and variance. Choose a seed and sample size, plot both paths and their ACFs, and check the theoretical AR(1) ACF. Explain why finite-sample values may differ from theory and state which financial conclusions this does not support. Score 0–2 points for each of: parameters and assumptions; seed and reproducibility; moment-matching derivation; time axis/units; and evidence boundaries, for a total of 10 points.
16-C02 (Challenge: real-data research design). Use monthly French NoDur returns to design a study of whether past returns improve next-month return forecasts. Specify units, timestamps, rolling windows, benchmarks, residual diagnostics, and falsifiable conditions; assess whether the current cache supports a point-in-time backtest. Score 0–2 points for each of: source and version; target and timing; leakage-free validation; benchmarks and metrics; and limitations and disconfirming evidence, for a total of 10 points.
16. Programming Exercises
P01–P03 were listed in the previous section and respectively require a frequency contract, a forecast using historical data only, and residual diagnostics. Programming reference solutions must use the core implementation in quant_course.time_series; do not reimplement ACF or fitting logic in a notebook.
17. Challenge Problems
C01 compares population laws with finite-sample plots; C02 examines the gap between a public snapshot, information timing, and evidence for historical strategies. Both questions guard against projecting a simulation property or a current release date backward into information available at the time.
Additional Exercises (Independent IDs)
- 16-N01 (Identification and hand calculation; §§3.1, 6.1.1): Run an AR(1) with unconditional variance 0.0048 from a fixed-mean starting value,
. Find the variances of the first three months and explain why a stable recursion does not make the process stationary from its initial state. Must the mean of a long path converge to the population mean? Give a counterexample. - 16-N02 (Diagnosis; §§6.2–6.3): Given the cosine white noise with
, find the next-period conditional mean. Why does it disprove “white noise cannot be predicted”? Separately state the inputs to an MA model and to a rolling average of prices. - 16-N03 (Forecast reconstruction and research judgment; §§6.5–6.6): The last level is 102; forecasts of the next two changes are 1 and 2, with error variances 4 each and covariance 1. Find the two level forecasts and the second-period error variance. If only February and April monthly returns are available, how should the lag between adjacent rows be handled? If ARIMA is fit to the original level with
, should its output be cumulated again?
18. Solutions / Solution Hints
16-E01 Answer. Strict stationarity requires all finite-dimensional joint distributions to be invariant under a common time shift. Weak stationarity restricts only the constant mean, finite constant variance, and autocovariance that depends on lag alone. Under strict stationarity with finite second moments, the marginal mean and variance do not change over time, and a covariance between any two dates is determined by the joint distribution at their separation of
16-E02 Answer. Let
Therefore adjacent innovations are not independent. White noise guarantees only second-order uncorrelatedness; it does not replace the IID assumption.
16-E03 Answer. The theoretical AR(1) ACF tails off as
16-E04 Answer. After March is removed, shift(1) treats the February row as the previous observation for April even though they are two months apart. Keep the month labels, create a monthly PeriodIndex, and validate that its index is consecutive. Check the source and meaning of a missing month; use a clearly appropriate missing-data model or restrict the sample. Do not call the gap a one-month lag or fill it with zero by default.
16-E05 Answer. An upward trend may come from a deterministic trend, stochastic trend, structural change, adjustment convention, or sample selection; a price chart cannot distinguish these. High persistence in the price level does not establish linear predictability of the return
16-E06 Answer. A confidence interval for the conditional mean concerns uncertainty in estimating an unknown mean. A prediction interval concerns one future random observation and therefore includes future innovation variance. A standard normal AR(1) interval treats
16-E07 Step-by-step solution. Read
The monthly-return standard deviation is about 6.928%. Next,
16-E08 Step-by-step solution. The current deviation from the mean is
That is 1.375%. The one-step error variance contains one future innovation, (0.0036). The two-step error is
16-E09 Step-by-step solution. The MA(1) variance is the sum of the variances of two uncorrelated innovations:
Under the chapter's convention for (1+0.5L), the root is
16-E10 Step-by-step solution.
16-P01 Reference implementation. Run the following script by itself. It creates a consecutive monthly PeriodIndex and calculates ACF/PACF; the validator rejects an index with a missing month.
import pandas as pd

from quant_course.time_series import (
    sample_acf_pacf,
    simulate_stationary_pair,
    validate_monthly_series,
)

pair = simulate_stationary_pair(n=240, seed=20261016, phi=0.7)
summary = sample_acf_pacf(pair["ar1"], lags=12)
print("n:", len(pair), "lag-1 ACF:", float(summary.loc[1, "acf"]))
assert summary.index[0] == 1 and summary.index[-1] == 12
missing_month = pd.Series(
    [0.01, 0.03], index=pd.PeriodIndex(["2000-01", "2000-03"], freq="M")
)
try:
    validate_monthly_series(missing_month)
except ValueError as error:
    print("gap rejected:", error)
else:
    raise AssertionError("a missing calendar month was accepted")
16-P02 Reference implementation. Only the first 180 months are passed to forecast_arima. The program reads the realized first test-month value only for retrospective scoring and asserts that the forecast target is exactly that month.
from quant_course.time_series import (
    forecast_arima,
    simulate_stationary_pair,
    split_monthly_series,
    training_mean_forecast,
)

returns = simulate_stationary_pair(n=240, seed=20261016, phi=0.7)["ar1"]
train, test = split_monthly_series(returns, train_size=180)
prediction = forecast_arima(train, steps=1, order=(1, 0, 0))
baseline = training_mean_forecast(train, steps=1)
print({
    "origin": str(train.index[-1]),
    "target": str(prediction.index[0]),
    "arima": float(prediction.iloc[0]["forecast"]),
    "training_mean": float(baseline.iloc[0]),
    "realized_for_scoring": float(test.iloc[0]),
})
assert prediction.index[0] == test.index[0]
assert train.index[-1] + 1 == test.index[0]
16-P03 Reference implementation. model_df=1 subtracts one degree of freedom for the estimated AR(1) coefficient; lag=12 jointly checks the first 12 months.
from quant_course.time_series import (
    fit_arima,
    ljung_box_diagnostic,
    simulate_stationary_pair,
)

series = simulate_stationary_pair(n=240, seed=20261016, phi=0.7)["ar1"]
training = series.iloc[:180]
fitted = fit_arima(training, order=(1, 0, 0))
model_df = 1
lag_months = 12
test = ljung_box_diagnostic(fitted.residuals, model_df=model_df, lag=lag_months)
print(test.to_string())
print("reference chi-square degrees of freedom:", lag_months - model_df)
print("H0: the first 12 residual autocorrelations are jointly zero; non-rejection is not proof of IID.")
16-C01 Reference argument, values, and scoring. Set the marginal target standard deviation to
import numpy as np

from quant_course.time_series import sample_acf_pacf, simulate_stationary_pair

pair = simulate_stationary_pair(n=480, seed=20261016, mean=0.005, marginal_sd=0.04, phi=0.7)
for name in ("iid", "ar1"):
    acf_values = sample_acf_pacf(pair[name], lags=12)
    print(name, "mean", f"{pair[name].mean():.6f}", "sd", f"{pair[name].std(ddof=1):.6f}", "rho1", f"{acf_values.loc[1, 'acf']:.6f}")
assert pair.index.freqstr == "M"
Score 0–2 points for each item: state
16-C02 Reference research design, acceptable conclusion, and scoring. The current data can demonstrate converting month-label strings to a monthly PeriodIndex, validating consecutive months, and calculating return mean, standard deviation, and ACF. It does not provide the version of each observation available in each historical month, announcement or ingestion available_at, or the historical time when a signal first became available. A defensible conclusion is therefore: “On the current French release snapshot saved on 2026-10-05, the descriptive statistics for NoDur monthly returns are …; these data are insufficient to assess real-time historical forecasting ability.” Do not treat the download date as the monthly information time back to 1926, and do not treat industry-portfolio returns as executable single-stock prices.
To extend this to a forecasting study, obtain and retain the version and timestamp visible for each observation at the time. Define the information cutoff for
Score 0–2 points for each item: correctly identify the data version and industry-portfolio units (2); distinguish month labels, release times, signal_time, trade_time, and the target-return interval (2); use time-ordered rolling forecasts trained only on the past (2); define a naive benchmark and out-of-sample metric in advance (2); state the lack of historical point-in-time versions and give disconfirming conditions (2). Calling the current CSV point-in-time data or treating ACF as alpha earns zero for both timing and evidence.
Answers to the Additional Exercises
16-N01. The first three variances are
16-N02. The next value is
16-N03. The level forecasts are 103 and 105; the second-period error variance is
19. Further Reading
- Must Know: statsmodels
ARIMAand ARIMAget_forecast. Focus on, trend, missing-data handling, stationarity/invertibility constraints, and the future prediction-interval API. Software documentation explains how a model is computed; it does not prove that your series meets its assumptions. - Must Know: statsmodels
acf,pacf, and Ljung–Box. Read about missing-data handling, denominator adjustments, PACF algorithm options, and degrees of freedom viamodel_df. - Should Know: statsmodels
ArmaProcess. Review lag-polynomial coefficient signs, AR/MA roots, and the stationarity and invertibility Boolean properties; this helps prevent mixing sign conventions for MA models across textbooks. - Should Know: statsmodels ARMA: synthetic-data example. Read the sections on ACF/PACF, estimation, and residual checks for a synthetic ARMA series; the example does not replace point-in-time financial data.
- Advanced: The time-series analysis frameworks of Box and Jenkins and Hamilton's time-series textbook. Use them to study likelihood estimation, root conditions, forecast errors, and diagnostics in more depth. This chapter does not claim to have checked the specific editions or page numbers of these copyrighted books.
20. References
The definitions and AR(1)/MA(1) moment formulas in this chapter are derived independently; statsmodels documentation is used to verify code interfaces and parameter meanings. For full verification dates, page ranges read, runtime dependencies, and conclusions unsupported by the data, see source_notes.md.
- Official statsmodels documentation for
ARIMA,ARIMAResults.get_forecast,acf,pacf,acorr_ljungbox, andArmaProcesssupports the implementation and API descriptions in this chapter; it does not support claims that the model is valid or that markets are predictable. - Kenneth R. French Data Library 10 Industry Portfolios data description supports the source and field background for the downloaded portfolio file. The numbers in this chapter were cross-checked against the cache and hash manifest. The public download page is not treated as a general license for redistribution beyond the course directory.