CHAPTER 41/ 45
: Unsupervised Learning
Author: Yuxiao Ma. The existing A8-B constructed implementation has limited-scope acceptance pending formal integration; this does not mean that real research is complete. Main thread: PCA and clustering do not use labels; they compress variance and distance structure. High explained variance does not imply predictive power, and a cluster-derived state is not an economic mechanism. These methods can enter a tradable study only when scaling, principal components, and cluster centers are fitted within the training window, and later dates are projected or assigned afterward. Full-sample PCA, hindsight state labels, and state probabilities smoothed with future data all leak information. Prerequisites: Chapter 5 linear algebra (eigendecomposition, orthogonal projection), Chapter 15 factor models (covariance, factor exposures), Chapter 16 Time Series I (rolling windows and autocorrelation), and Chapter 38 pipelines (training-only fitting and date-based walk-forward). By the end, you should be able to calculate the principal component and explained-variance ratio of a 2 × 2 covariance matrix by hand; explain how scaling changes principal components; calculate out-of-sample reconstruction
for training-fitted PCA and explain why it is lower than the in-sample value in this example without treating that ordering as a per-window theorem; use k-means to assign rolling market-state features online and test cluster stability; calculate one hidden Markov filter update by hand and distinguish filtered from smoothed probabilities; and use constructed data to show how much hindsight state labels can improve the apparent performance of a strategy.
1. Learning Objectives
- State the PCA objective (the maximum-variance direction is an eigenvector of the covariance matrix), calculate eigenvalues, loadings, and explained-variance ratios for a 2 × 2 example, and explain sign indeterminacy and this book's sign convention.
- Explain the difference between covariance PCA and correlation-matrix PCA (standardize first), and why standardization parameters must be estimated only from training rows.
- Fit PCA within a training window, project later dates, and calculate out-of-sample reconstruction
; use the noise eigenvalue bound for a random matrix to explain why in-sample explained variance is inflated. - Use a constructed example to show that high explained variance by itself does not guarantee predictive power for future returns, and test this in Project 6 v2's PCA+Ridge ablation.
- State the k-means objective and Lloyd iterations; explain how distance depends on scaling, why cluster labels are arbitrary, and why the number of clusters must be selected; calculate the adjusted Rand index (ARI) under row bootstrap resampling and explain that it measures sensitivity to row perturbations only, while temporal stability requires block resampling or rolling refits.
- Assign market states online using features that depend only on past data; write the filtering recursion for a two-state hidden Markov model and calculate one step by hand; explain that smoothed probabilities use future observations.
- Compare five market-timing rules after costs in a constructed two-state market: hindsight true state, smoothed probability, centered rolling volatility (which uses future data), filtered probability (traded with a one-day lag), and online training-fitted k-means assignment.
Completion criteria: Sections 15–17 can be completed independently; code/ch41_unsupervised.py reproduces the numbers in Sections 8–10.
2. Why Quant Needs It
Two common tasks do not rely on labels. The first is risk compression: estimating a return covariance matrix for hundreds of stocks requires estimating tens of thousands of parameters, while most common return variation can be explained by a few directions (market, industry, and style). Statistical factor models use PCA to find these directions for risk estimation, residual-return construction, or hedging. The second is regime detection: a researcher wants to know whether the market is currently calm or volatile in order to adjust positions, leverage, or models.
Both tasks invite time leakage. When PCA estimates a covariance matrix using the full sample, principal components for early dates already contain later volatility structure. When a state model smooths over the full sample, a day may be labeled “volatile” partly because of declines in the following days. Both practices make research results look better, but neither is available in live trading. This chapter pairs each tool with a version fitted within the training window and used out of sample, then uses constructed data to quantify the gap.
3. Intuition
PCA. For returns recorded in percentage points, the covariance matrix (in squared percentage points) for two stocks is
Clustering. Plot each day's “past-month annualized volatility” against its “past-three-month cumulative return.” Calm up-market days cluster in a low-volatility, positive-return corner, while crisis days cluster in a high-volatility, negative-return corner. k-means assigns each point to its nearest center. Intuitively, clustering finds days that are close to one another.
Boundary. Neither example involves future returns. The first principal component explains the most variance, but that says nothing about its ability to predict anything next period. “Cluster 1” is simply a set of days close in distance; calling it a “crisis regime” is a name supplied by the researcher. Section 8 demonstrates both points numerically.
4. Mathematical Foundations
| Symbol | Meaning | Dimension / units |
|---|---|---|
| Training-window data matrix: |
Returns in decimals or percent; features in their original units | |
Column means and sample standard deviations in the training window (ddof=1) |
Same units as the columns | |
| Training-window data after centering (and optionally standardizing), with |
— | |
| Sample covariance matrix (the correlation matrix after standardization) | Units squared | |
| Eigenvalues and unit eigenvectors (loadings) of |
Units squared; dimensionless | |
| First |
||
| Principal-component scores on date |
Same units as |
|
| Number of clusters and cluster centers | — | |
| Latent state on date |
— | |
| Transition matrix | Rows sum to 1 | |
| Normal density for an observation in state |
1 / unit |
Timing convention. State features and principal components are calculated at close
5. Formal Definitions
Principal component analysis (PCA). The first loading is
Explained-variance ratio.
Out-of-sample reconstruction
On the training window, this equals the sum of the explained-variance ratios for the first
Sign indeterminacy. Both
Scaling. In covariance PCA, columns with larger variance dominate. In correlation-matrix PCA, each column is first divided by its training standard deviation. The choice depends on the use case: covariance PCA is common for risk compression because higher-volatility assets contribute more risk; feature reduction commonly standardizes first because variances in different units are not directly comparable.
k-means. Given n_init runs multiple initializations and keeps the best. Distance depends on each column's units, so standardize using training rows first.
Arbitrary cluster labels (label switching). The labels 0 and 1 have no intrinsic meaning and may be swapped after refitting. In this book, after fitting, clusters are relabeled in ascending order of their centers on the training-window “volatility” column. Use the Hungarian algorithm to match state labels when comparing them element by element; ARI itself is invariant to label permutations and requires no prior matching.
Cluster stability. Perturb the data (for example, with bootstrap resampling or a different window), refit clustering, and compare assignments. The adjusted Rand index (ARI) corrects agreement between two partitions for chance: perfect agreement is 1, and random partitions have an expected value around 0. The perturbation determines what the result means. An IID row bootstrap of dates measures only sensitivity to replacing some rows. The state features use overlapping 21-day and 63-day windows, so neighboring dates are highly correlated; row resampling does not establish temporal stability. Use block bootstrap or rolling refits for that.
Regime detection. Assign dates to a small number of “states” for conditional decisions. This chapter distinguishes three types of labels: online labels (using data through
Hidden Markov model (HMM). The state
Factor interpretation. Naming a principal component “market,” “size,” or “value” is an interpretation made by comparing its loadings with known characteristics. Loadings can rotate across windows, so the name is not automatic.
6. Derivations
6.1 The Maximum-Variance Direction Is an Eigenvector
Maximize
2 × 2 example.
6.2 Scaling Changes the Principal Components
Suppose the two columns have variances 4 and 1 and correlation 0.5, so their covariance matrix is
6.3 In-Sample Explained Variance Is Inflated: A Noise Eigenvalue Bound
Suppose there are
Laloux et al. (1999) applied this to financial correlation matrices (see the reading notes in Section 20). With
6.4 High Explained Variance Does Not Guarantee Predictive Power
Suppose two features are independent,
6.5 Monotonic Descent of k-means
With centers fixed, assigning every point to its nearest center cannot increase the objective, because each point takes its minimum distance. With assignments fixed, replacing each center with its cluster mean minimizes within-cluster squared distance (as in Section 6.1 of Chapter 40: the mean is the optimal constant under squared loss). Alternating the two steps makes the objective non-increasing and bounded below by 0. A lower bound guarantees convergence of the objective value, but alone does not imply termination in finitely many steps. With finitely many partitions, a deterministic tie rule that prevents cycling, and fixed empty-cluster handling, if every partition change strictly decreases the objective, the algorithm terminates in finitely many steps. Implementations may also stop at a tolerance or iteration cap. The result is generally a local fixed point, not a global optimum; different initializations can reach different partitions, one reason to test cluster stability separately.
6.6 Filtering Recursion and Smoothing
Let
- Prediction:
, by the law of total probability and the Markov property. - Update:
, by Bayes' rule and conditional independence of observations given the states.
With parameters fixed from the training window,
The hand calculation in Section 8.3 uses these parameters: the stationary distribution under
7. Financial Interpretation
Statistical factors and economic factors. PCA returns directions of maximum training-window variance. Economic factors such as market, size, and value come from theory or portfolio sorts. They may be similar (the first principal component often correlates highly with an equal-weighted market) or different. Statistical factors avoid having to specify factors in advance, but loadings rotate across windows, signs are arbitrary, and names require later interpretation. For a risk model, also test whether the factors explain as much variance out of sample.
Uses of risk compression. A low-rank covariance matrix from the first
States and mechanisms. Clustering or an HMM may group “high-volatility, negative-return” days together; that is descriptive. Calling the group a “crisis regime” and reducing exposure assumes that subsequent returns will also be worse. This prediction must be tested out of sample. State persistence and detection delay (a filtered probability may take several down days to switch) also reduce returns.
Tradability. Every state rule must answer: what do you know at close
8. Numerical Example
All numbers in this section are constructed for teaching: Sections 8.1 and 8.3 are hand calculations checked against code; Sections 8.2 and 8.4 come from simulations in code/ch41_unsupervised.py (the seeds are recorded in the script's docstring), not market data.
8.1 Hand-Calculating Principal Components and Scaling
Covariance matrix loadings[:, j] is the
Covariance matrix unsupervised_tools.pca_fit (results.json under hand.pca).
import numpy as np
for S in ([[2, 1], [1, 2]], [[4, 1], [1, 1]], [[1, 0.5], [0.5, 1]]):
    w, v = np.linalg.eigh(np.array(S, float))
    w, v = w[::-1], v[:, ::-1]
    v = v * np.where(v.sum(axis=0) < 0, -1, 1)  # sign convention: loadings sum > 0
    print(np.round(w, 4), np.round(v[:, 0], 4), np.round(w / w.sum(), 4))
Output:
[3. 1.] [0.7071 0.7071] [0.75 0.25]
[4.3028 0.6972] [0.9571 0.2898] [0.8606 0.1394]
[1.5 0.5] [0.7071 0.7071] [0.75 0.25]
8.2 In-Sample and Out-of-Sample Results: Factor and Pure-Noise Panels
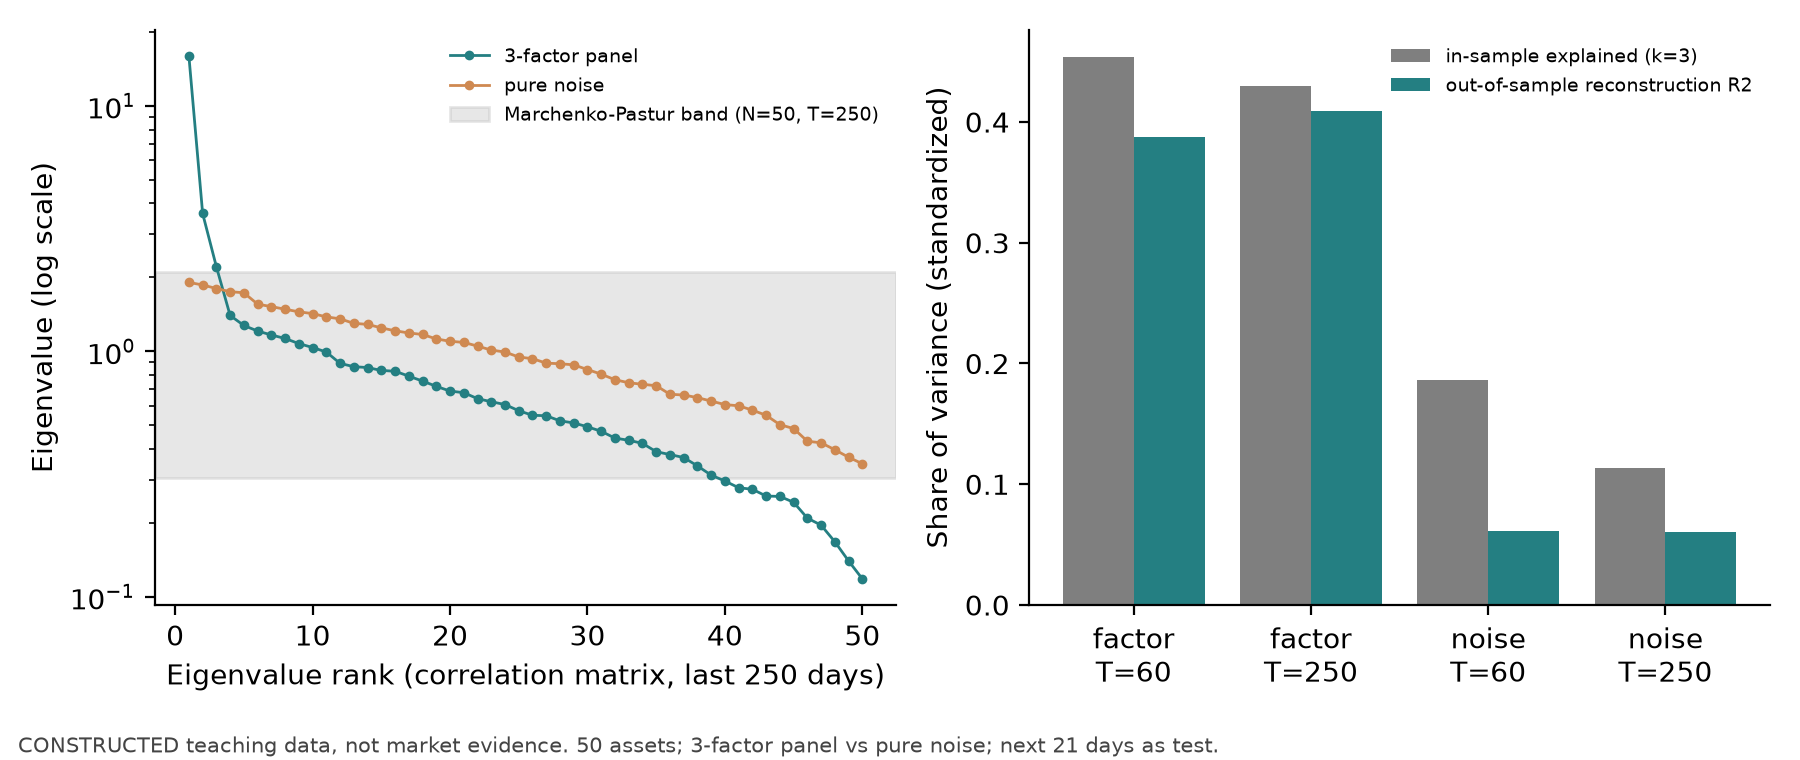
Two constructed return panels have 50 assets and 1,000 days. Factor panel: three factors with daily volatilities of 1.0%, 0.5%, and 0.3%; idiosyncratic volatility of 1.5%; and loadings drawn from
| Panel | In-sample share (first 3) | Out-of-sample reconstruction |
Full-sample PCA test-window |
Principal-angle cosines |
|
|---|---|---|---|---|---|
| Factor | 60 | 0.454 | 0.388 | 0.420 | 0.993 / 0.944 / 0.736 |
| Factor | 250 | 0.429 | 0.409 | 0.419 | 1.000 / 0.997 / 0.988 |
| Noise | 60 | 0.186 | 0.061 | 0.085 | 0.867 / 0.659 / 0.286 |
| Noise | 250 | 0.113 | 0.060 | 0.085 | 0.971 / 0.919 / 0.627 |
Interpretation. (1) In the noise panel, the true share for three directions is subspace_cosines): take the singular values of
8.3 Hand-Calculating One Filtering Step
Two states: daily returns in the calm state (0) follow
- Prediction:
. - Densities (units of 1 / decimal return):
(3.64 standard deviations away), and (1.2 standard deviations away). - Update:
and . Normalizing gives .
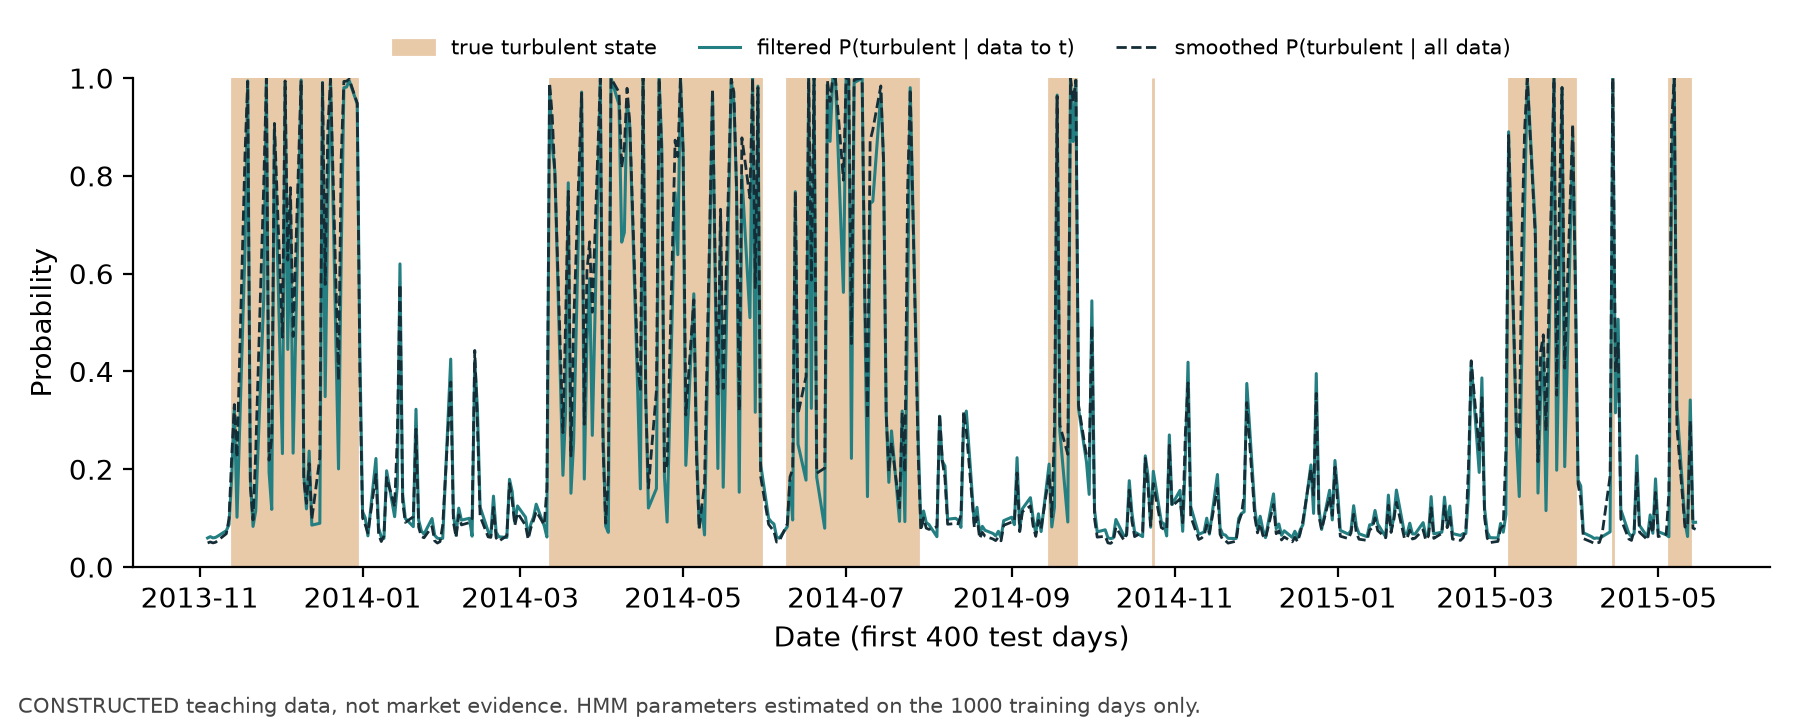
A one-day drop of −2.5% raises the volatile-state probability from 11.3% to 94.3%. If today's return were −1.0%, the two densities would be 18.50 and 18.03, nearly equal, and hmm_filter_smooth(x=[x_t], init=predicted_probability) (hand.hmm). The stationary distribution is
import numpy as np
from scipy.stats import norm
P = np.array([[0.98, 0.02], [0.05, 0.95]])
pred = np.array([0.9, 0.1]) @ P
for x in (-0.025, -0.010, 0.003):
    lik = np.array([norm.pdf(x, 0.0005, 0.007), norm.pdf(x, -0.001, 0.02)])
    print(x, np.round(pred, 3), np.round(pred * lik / (pred * lik).sum(), 4))
8.4 Regime Timing: Hindsight Labels, Online Labels, and Costs
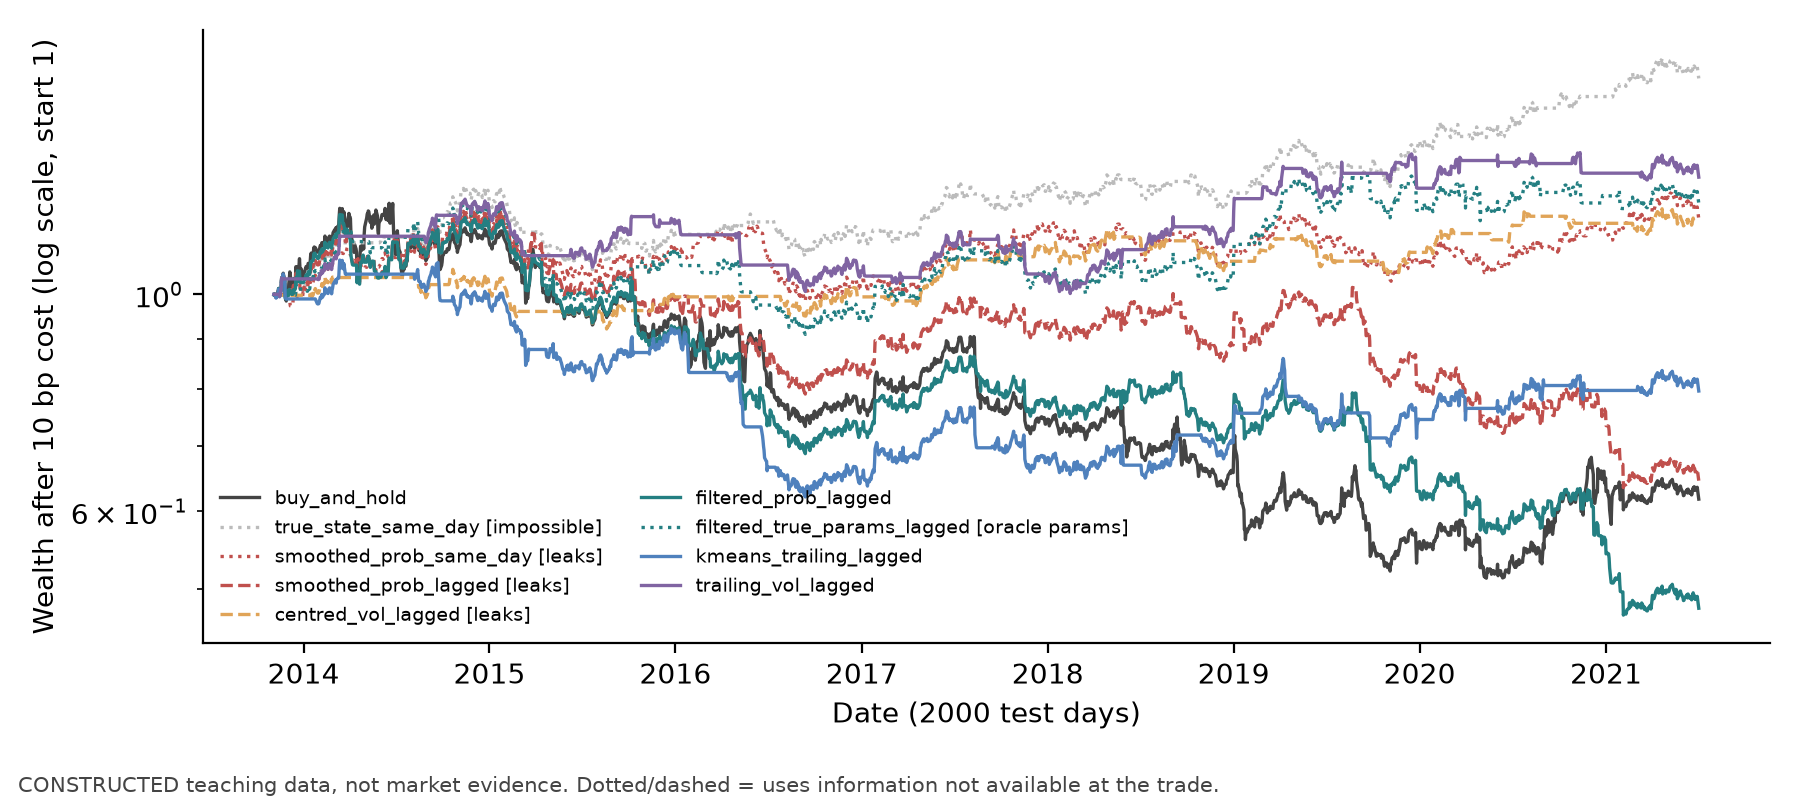
Constructed market: 3,000 days, with states generated from the Markov chain above (seed 4102); the first 1,000 days are the training window and the remaining 2,000 are the test window. The rules use two position sizes: hold the market (weight 1) when classified as calm, and hold cash (weight 0) otherwise. “Lagged” follows the information clock in Section 4: a signal at close
| Rule (2,000 test days) | Available when? | Annualized return | Sharpe | Maximum drawdown | Annual turnover | State accuracy |
|---|---|---|---|---|---|---|
| Buy and hold | Available | −5.89% | −0.22 | −58.6% | 0.1 | 0.747 |
| True state, same-day | Unavailable | +6.61% | 0.71 | −17.8% | 8.7 | 1.000 |
| Smoothed probability, same-day | Leaks | +2.27% | 0.28 | −19.5% | 33.9 | 0.871 |
| Smoothed probability, lagged execution | Leaks | −5.38% | −0.28 | −47.6% | 33.9 | 0.871 |
| Centered 21-day volatility, lagged | Leaks | +2.21% | 0.33 | −13.1% | 12.9 | 0.704 |
| Filtered probability (training-estimated parameters), lagged | Available | −8.89% | −0.51 | −61.0% | 39.4 | 0.856 |
| Filtered probability (true parameters), lagged | Parameters unavailable | +2.73% | 0.28 | −26.8% | 11.5 | 0.940 |
| Online k-means state, lagged | Available | −2.83% | −0.15 | −42.7% | 5.9 | 0.792 |
| Past 21-day volatility, lagged | Available | +3.54% | 0.41 | −19.9% | 12.7 | 0.689 |
Let
| Signal formed (close) | Execution (next close) | Holding-return interval | Position in return series |
|---|---|---|---|
| October 12 | October 13 | Close October 13 to close October 14 | |
| October 13 | October 14 | Close October 14 to close October 15 |
The numerical results in this chapter use a fixed-weight-change proxy:
Thus, the weight on return-ending date
Results from a single path are highly sensitive to chance. As a post hoc robustness diagnostic (D11; not a registered primary result or confirmatory evidence), the same design was repeated with 50 additional seeds. The table shows median Sharpe and the share of paths in which Sharpe exceeded buy and hold on that same path:
| Rule | Median Sharpe | Share beating buy and hold | Median annual turnover |
|---|---|---|---|
| Buy and hold | 0.02 | — | 0.1 |
| True state, same-day (unavailable) | 0.86 | 1.00 | 7.2 |
| Smoothed probability, same-day (leaks) | 0.76 | 0.98 | 32.3 |
| Smoothed probability, lagged (leaks) | 0.05 | 0.54 | 32.3 |
| Centered volatility, lagged (leaks) | 0.63 | 1.00 | 8.8 |
| Filtered probability (training-estimated parameters) | −0.03 | 0.38 | 38.3 |
| Filtered probability (true parameters, unavailable) | 0.38 | 0.90 | 12.2 |
| Online k-means state | 0.29 | 0.90 | 6.1 |
| Past volatility | 0.35 | 0.78 | 8.8 |
There are four takeaways. (1) Same-day hindsight labels earn the most because they use that day's return: after a large daily decline, the smoothed probability classifies that day as volatile, so the rule is “conveniently” out of the market on that day. When the same smoothed probability is executed on the valid schedule (
Cluster stability on training-window features, using 20 IID row bootstrap samples (a sensitivity check to row perturbations only, not a temporal-stability test): at
9. Python Implementation
-
Core module:
src/quant_course/unsupervised_tools.py. -
Interface contract: Section 2 of
qa/a8/ch40_ch41_batch/INTERFACE_CONTRACT.md. Public functions:pca_fit,pca_project,pca_reconstruction_r2,subspace_cosines,trailing_state_features,fit_kmeans_states,assign_states,align_labels,cluster_stability,hmm_filter_smooth,simulate_markov_regimes, andsimulate_factor_panel. Tests:tests/test_unsupervised_tools.py. -
Chapter script, approximately 7 seconds. Pass only --out when reproducing results; --figures-dir
course/zh/chapters/ch41/figuresoverwrites the source figures and should be used only when intentionally refreshing them:.venv/bin/python code/ch41_unsupervised.py --out <new-output-dir>Output:
results.jsonand three figures. The command refuses to use an existing output directory. -
Environment: Python 3.14.7, numpy 2.5.3, pandas 3.0.6, scikit-learn 1.9.1, and scipy 1.18.1 (
.venv). -
Seeds: factor panel 4101; noise panel 4103; state market 4102; variance-and-predictive-power example 4104; robustness diagnostic 4200–4249.
KMeansand Gaussian-mixturerandom_statevalues match the corresponding seeds. -
Missing values:
pca_fitandpca_projectraise an error on NaN (the caller must handle them first);trailing_state_featuresreturns NaN when the window is insufficient;assign_statesreturns NaN for rows containing NaN, and the rules treat NaN as a flat position. -
Timing: daily frequency; signal at close
; execution at close ; return interval from close to close . Leakage-comparison rules are named with [leaks],[impossible], or[oracle params].
Minimal example of training-only PCA and out-of-sample projection:
import numpy as np, pandas as pd
from quant_course import unsupervised_tools as ut
R, B = ut.simulate_factor_panel(300, 20, factor_vols=(0.01, 0.005), idio_vol=0.015, seed=1)
fit = ut.pca_fit(R.iloc[:250], 2, standardize=True)  # mean, SD, loadings: training rows only
scores = ut.pca_project(R.iloc[250:], fit)           # later dates use the training mean/SD
r2 = ut.pca_reconstruction_r2(R.iloc[250:], fit)
print(fit.explained_ratio.round(3), round(r2, 3), scores.shape)
10. Visualization
- Figure 1 (
figures/fig41_1_pca_in_vs_out.png, Section 8.2): the horizontal axis is eigenvalue rank and the vertical axis is eigenvalue (log scale); the gray band marks the Marchenko–Pastur range. The right plot's horizontal axis shows fourpanel/windowcombinations and its vertical axis shows variance shares. Compare noise eigenvalues with the MP range and in-sample with out-of-sample results. - Figure 2 (
figures/fig41_2_filtered_vs_smoothed.png, Section 8.4): date on the horizontal axis and probability on the vertical axis; observe the “foresight” in smoothed probabilities. - Figure 3 (
figures/fig41_3_regime_rules.png): wealth after 10 basis points of cost across 2,000 test days (log scale, starting at 1). Dashed and dotted lines are rules that use information unavailable at trade time.
11. Real-Market Example
Status: Experiment pending. This course does not have authorization to use a daily stock or index return panel (projects/project06/data_manifest.json; real_data.status = blocked), so this chapter reports no real-market principal components, states, or timing results. To conduct the study, obtain: (1) at least eight years of daily stock returns with point-in-time constituents (including delisted stocks), for training-only PCA, out-of-sample reconstruction
Literature comparison (not evidence from this book): Laloux et al. (1999) used the return correlation matrix for S&P 500 constituents and found that most eigenvalues fell inside the Marchenko–Pastur range, with only a few (the largest corresponding to the market) clearly outside it. Ang and Timmermann (2012) review applications of regime-switching models in asset pricing. Reading status is documented in Section 20.
12. Common Mistakes
12.1 Full-Sample Standardization and PCA
Mistake: StandardScaler().fit(R) and PCA().fit(R) use all dates, and the resulting scores are treated as daily risk factors or features. Why: test-period means, volatilities, and correlation structure enter the training-period transformation. Impact (noise panel in Section 8.2): full-sample PCA has test-window reconstruction pca_fit on the past window only and use pca_project on later dates.
import numpy as np, pandas as pd
from quant_course import unsupervised_tools as ut
noise = pd.DataFrame(np.random.default_rng(4103).normal(0, 0.015, (1000, 50)))
noise.columns = [f"A{i:02d}" for i in range(50)]
full = ut.pca_fit(noise, 3, standardize=True)               # WRONG: sees the test window
train = ut.pca_fit(noise.iloc[:250], 3, standardize=True)   # right: training window only
test = noise.iloc[250:271]
print(round(ut.pca_reconstruction_r2(test, full), 3),
      round(ut.pca_reconstruction_r2(test, train), 3),
      round(float(train.explained_ratio.sum()), 3))
The output 0.115 0.077 0.112 means that, on this single 21-day test window, full-sample PCA has reconstruction
12.2 Treating Smoothed Probabilities or Hindsight Labels as Trading Signals
Mistake: fit an HMM on the full sample and use smoothed probabilities, or label each day with a “crisis period” confirmed after the fact and align it with the same day's return. Why: the label uses future observations; same-day alignment also uses the return being evaluated. Impact (Section 8.4, median over 50 seeds): the same-day smoothed-probability Sharpe is 0.76, versus 0.05 when executed on the valid schedule (execute at
12.3 Centered Rolling Windows
Mistake: ret.rolling(21, center=True).std(). Why: the value for date rolling(21) (right-aligned by default), and test that changing data after
12.4 Unaligned Cluster Labels
Mistake: refit k-means in each window and compare “cluster 1” directly. Why: labels are arbitrary and can switch between fits. Impact: partitions align_labels for Hungarian matching; ARI itself is label-invariant.
12.5 Selecting Principal Components for Prediction by Explained Variance
Mistake: principal-component regression keeps only components that “explain 99% of the variance.” Why: PCA does not use labels. Impact (constructed example in Section 6.4; first half for training and second half for testing): the first covariance-PCA component explains 98.96% of feature variance, but its out-of-sample
12.6 Evaluating Market Timing by State Accuracy
Mistake: report “85.6% state-classification accuracy” as evidence that a strategy works. Why: accuracy weights each day equally and ignores the size of returns on misclassified days and turnover costs. Impact: the training-parameter filter in Section 8.4 has accuracy 0.856 and Sharpe −0.51; the past-volatility rule has accuracy 0.689 and Sharpe 0.41. Fix: report after-cost returns, turnover, and drawdown together.
13. Quant Research Application
Hypothesis. Do high-variance directions (principal components) of cross-sectional features contain predictive information about future five-day returns? This auxiliary ablation was specified in the Project 6 v2 protocol before v2 runs (configs/p06_trees_v2.json, pca_ridge), not a standalone strategy project. The v1 constructed results had already been viewed; this was not an ex-ante real-market preregistration.
Method. For each outer fold in the date-based walk-forward of Chapter 38, fit StandardScaler, PCA(
Controls and interpretation limits. The 43 projects/project06/research_report/v2_trees.md.
Clustering and states. This batch does not add cluster states to Project 6: the constructed “sign-reversal” scenario changes the relation between cross-sectional features and returns, while market-level volatility and returns are unchanged. Clustering on market-state features therefore has no identifiable target. A state-rule study requires a separate protocol (Section 17, 41-C02).
14. Chapter Summary
PCA and clustering answer “how are the data distributed?” rather than “what will happen next?” PCA eigenvalues give training-window variance shares. In-sample shares are biased upward by noise; out-of-sample reconstruction
15. Exercises
41-E01 (by hand) Let
41-E02 (scaling) Two uncorrelated columns have variances 9 and 1. (a) What are the first covariance-PCA loading and explained share? (b) What is special about correlation-matrix PCA after standardization? (c) Using (a) and (b), explain when the “first principal component” depends on the units of measurement.
41-E03 (noise bound) There are
41-E04 (interpretation) Why is a dollar-neutral portfolio with zero market exposure almost unaffected by the first return principal component (which is approximately the market)? What does this say about the relationship between explained variance and portfolio predictive power?
41-E05 (k-means) For one-dimensional data
41-E06 (filtering) Use the parameters in Section 8.3. Convert returns, means, and standard deviations to decimal returns for density calculations (
41-E07 (timing) Which of the following are available at close center=True); (c) filtered probability with parameters estimated in the training window; (d) filtered probability from an HMM fitted on the full sample; (e) smoothed probability from an HMM fitted on the full sample; (f) nearest-center assignment for past features using k-means fitted in the training window.
41-E08 (cluster labels) What are the ARI and elementwise agreement for partitions
16. Programming Exercises
41-P01 (training-only PCA) Input: generate 500 days and 30 assets with simulate_factor_panel, factor_vols=(0.01, 0.004), idio_vol=0.015, and seed=7. Implement a rolling window (
41-P02 (filtering does not look ahead) Use hmm_filter_smooth on the 500-day series from simulate_markov_regimes with p_stay=(0.97, 0.9), mus=(0.0005, -0.001), sigmas=(0.008, 0.02), and seed=3. Acceptance assertions: (1) changing
41-P03 (state-rule backtest) Given a daily return series and a 0/1 signal, implement the simplified fixed-weight proxy “signal at close
17. Challenge Problems
41-C01 (Project 6 v2 PCA ablation) Compare the results and selected pca_ridge in Chapter 40, Section 13, and projects/project06/research_report/v2_trees.md. (a) How do the results compare with the metric-by-metric reference and interpretation limits in Section 13? (b) Give a constructed data-generating process in which PCA+Ridge outperforms Ridge on the original features and explain what real-world situation it represents. (c) Explain why you cannot change the
41-C02 (honest state-study design) Design a state-timing study for a tradable index. Specify the number of states, parameter estimation (for example, Baum–Welch EM on training windows only), online signal, execution time, costs, evaluation metrics, benchmarks, out-of-sample period, and falsification condition. Explain how you prevent leakage from Sections 12.2 and 12.3 and how you report the effects of parameter-estimation error (as in the true-parameter comparison in Section 8.4). Additional prerequisites: Chapter 35 on trading costs, Chapter 31 on validation, and Chapter 32 on performance evaluation.
18. Complete Solutions
41-E01.
41-E02. (a) The covariance matrix is
41-E03.
41-E04. If stock
41-E05. Step 0: with centers 0.10 and 0.15, the midpoint is 0.125. Assign
41-E06. Convert the returns, means, and standard deviations to decimal returns first; densities are measured “per unit decimal return,” while normalized state probabilities are dimensionless. The prediction is
41-E07. Available: (a), (c), and (f). Unavailable: (b), which uses the next 10 days; (d), because although the filtering recursion itself uses only
41-E08. For the first pair, both partitions group the same points and only swap labels, so ARI = 1; elementwise agreement is
41-P01. Reference implementation.
import numpy as np
from quant_course import unsupervised_tools as ut


def rolling_in_out(R, window=120, test=20, k=2):
    rows = []
    for s in range(window, len(R) - test + 1, test):
        fit = ut.pca_fit(R.iloc[s - window:s], k, standardize=True)
        oos = ut.pca_reconstruction_r2(R.iloc[s:s + test], fit)
        rows.append((float(fit.explained_ratio.sum()), oos))
    return np.array(rows)


R, _ = ut.simulate_factor_panel(500, 30, factor_vols=(0.01, 0.004), idio_vol=0.015, seed=7)
a = rolling_in_out(R)
assert a[:, 0].mean() >= a[:, 1].mean()
R2 = R.copy()
R2.iloc[300:] *= 10                 # change only data from row 300 on
b = rolling_in_out(R2)
assert np.allclose(a[:8], b[:8])    # windows whose test ends by row 300 are unchanged
R3 = R.copy()
R3.iloc[120:140] += 0.05
assert not np.isclose(rolling_in_out(R3)[0, 1], a[0, 1])  # shifting the test changes R2
print(a.mean(axis=0).round(3))
The first test window is rows 120–139. The first eight windows end before row 300 and are therefore unaffected. The output reports averages of the two columns. This assertion for a fixed construction does not generalize to all data or establish that out-of-sample performance is always below in-sample performance.
41-P02. Reference implementation.
import numpy as np
from quant_course import unsupervised_tools as ut
m = ut.simulate_markov_regimes(500, p_stay=(0.97, 0.9), mus=(0.0005, -0.001),
                               sigmas=(0.008, 0.02), seed=3)
x = m["ret"].to_numpy()
kw = dict(means=[0.0005, -0.001], sds=[0.008, 0.02],
          transition=np.array([[0.97, 0.03], [0.1, 0.9]]), init=[1.0, 0.0])
f1, s1 = ut.hmm_filter_smooth(x, **kw)
x2 = x.copy()
x2[301:] = -0.05
f2, s2 = ut.hmm_filter_smooth(x2, **kw)
assert np.allclose(f1[:301], f2[:301]) and not np.allclose(s1[:301], s2[:301])
assert np.allclose(f1.sum(axis=1), 1) and np.allclose(s1.sum(axis=1), 1)
P = np.array([[0.98, 0.02], [0.05, 0.95]])
one, _ = ut.hmm_filter_smooth(np.array([-0.025]), means=[0.0005, -0.001], sds=[0.007, 0.02],
                              transition=P, init=np.array([0.9, 0.1]) @ P)
assert np.allclose(one[0], [0.057059, 0.942941], atol=1e-6)
print("ok")
Metric conventions: let ddof=1); it is not CAGR divided by annualized volatility. Annual turnover is
41-P03. Reference implementation (same information clock and cost proxy as the book implementation in code/ch41_unsupervised.py; includes all metrics requested by the exercise and checks three assertions. Section 8.4 shifts the full 3,000-day series before taking the test segment; this example slices first and shifts afterward, leaving the first two test days flat, so the numbers differ from Section 8.4):
import numpy as np, pandas as pd
from quant_course import unsupervised_tools as ut


def book(ret, signal, cost, lag=2):
    w = signal.shift(lag).fillna(0.0)
    turn = w.diff().abs().fillna(w.abs())
    net = w * ret - cost * turn
    wealth = np.concatenate([[1.0], np.cumprod(1 + net.to_numpy())])
    n = len(net)
    if n == 0 or np.any(1 + net.to_numpy() <= 0):
        raise ValueError("Require observations and positive wealth multipliers")
    sd = float(net.std(ddof=1)) if n > 1 else float("nan")
    ann_return = float(wealth[-1] ** (252 / n) - 1)
    sharpe = float(np.sqrt(252) * net.mean() / sd) if sd > 0 else float("nan")
    return {"wealth": wealth, "annual_return": ann_return, "sharpe": sharpe,
            "turnover": float(turn.sum()), "annual_turnover": float(turn.sum() * 252 / n),
            "mdd": float((wealth / np.maximum.accumulate(wealth) - 1).min())}


m = ut.simulate_markov_regimes(3000, p_stay=(0.98, 0.95), mus=(0.0005, -0.001),
                               sigmas=(0.007, 0.02), seed=4102)
# The signal is sliced to the test window before shifting, so the first two test days are
# flat; code/ch41_unsupervised.py shifts the full series first (its §8.4 numbers differ).
ret, calm = m["ret"].iloc[1000:], (m["state"].iloc[1000:] == 0).astype(float)
bh = book(ret, pd.Series(1.0, index=ret.index), 0.0)
assert np.isclose(bh["wealth"][-1], np.prod(1 + ret.iloc[2:]))
same_day, lagged = book(ret, calm, 0.001, lag=0), book(ret, calm, 0.001, lag=2)
assert same_day["wealth"][-1] > lagged["wealth"][-1]
assert book(ret, calm, 0.001)["wealth"][-1] < book(ret, calm, 0.0)["wealth"][-1]
print(round(same_day["wealth"][-1], 3), round(lagged["wealth"][-1], 3))
41-C01. Complete reference answer. In the base scenario, PCA+Ridge has ranking/portfolio performance are different quantities.
One testable construction makes several features noisy measurements of a common latent variable
Changing the
41-C02. Complete protocol example. First confirm the index, total-return series, tradable instrument, and data permission; fix the training period and unseen test dates. Use only past 21-day volatility and 63-day return as state features, with the scaler estimated within each training window. Fix
For the actual strategy, use the Chapter 29 event ledger, one-way costs of 0/10/20 bp, and explicit assumptions for impact and financing. If a teaching proxy is also shown, state separately that it charges costs on the return-ending row and explain how it differs from the event ledger. Use buy and hold and a past-volatility rule as benchmarks. Report annualized return, Sharpe, drawdown, and turnover; results in crisis and calm periods; and results across initializations and rolling windows. Full-sample smoothing and centered windows are unavailable-to-trade diagnostics only and cannot be selected into the strategy. Interpret state labels from training-window centers; ARI does not require label alignment, while temporal stability requires block perturbation or rolling refits.
Before looking at test results, specify a decision rule; for example, do not adopt the strategy if its after-cost performance is no better than the past-volatility rule, its advantage appears in only one subperiod, or it is highly sensitive to initialization. A simulation with true parameters can serve as an unavailable oracle reference, not a guaranteed upper bound on after-cost returns or Sharpe: compare estimated and true transition matrices, false alarms and delay, turnover, and cost loss. Section 8.4's true-parameter median Sharpe of 0.38 versus −0.03 with training-estimated parameters shows that estimation error deserves investigation, but does not guarantee that EM will move estimates toward the true values. Real markets have no known true states or parameters; do not treat this simulation difference as a market result. Without authorization, real-market work remains blocked.
19. Further Reading
- Must know: Jolliffe and Cadima (2016), Section 2: choosing between covariance and correlation-matrix PCA and interpreting explained variance. Relevant to Sections 5–6.
- Should know: Laloux, Cizeau, Bouchaud, and Potters (1999): using random-matrix bounds for financial correlation matrices and assessing whether sample eigenvalues exceed noise. Hamilton (1989), Sections 3–4: Markov-switching models and
filtered/smoothedprobabilities. - Advanced: Ang and Timmermann (2012): a review of regime switching in asset pricing; read Sections 2 and 4. Connor and Korajczyk (1986): statistical factor models based on asymptotic principal components. von Luxburg (2010): theory and limitations of clustering stability.
- Optional: scikit-learn 1.9.1 documentation for PCA,
KMeans, andadjusted_rand_score, to check implementation details.
20. References
Reading statuses below refer to the original course author’s historical review recorded in source_notes; BIL19 inherits those statuses without reopening publications or performing new online verification.
Full links and reading locations are in references.md, references/sources.json, and this chapter's source_notes.md.
- NUMPY: NumPy documentation (linalg.eigh). Used for eigendecomposition in Sections 6.1 and 8.1. Reading status: based on the local 2.5.3 implementation.
- SK_PITFALLS: scikit-learn “Common pitfalls” (data leakage and training-only preprocessing). Used for scaling in Section 5 and Section 12.1. Reading status: carried forward from A8-A.
- CH41_JC2016: Jolliffe, I. T., & Cadima, J. (2016). Principal component analysis: a review and recent developments. Phil. Trans. R. Soc. A, 374, 20150202. Used in Section 5 and Section 6.2 on scaling. Reading status: the AMC reconnaissance report covered Section 2(c); the author did not reread it.
- CH41_LCBP1999: Laloux, L., Cizeau, P., Bouchaud, J.-P., & Potters, M. (1999). Noise dressing of financial correlation matrices. Physical Review Letters, 83, 1467–1470. Used for the bound and assumptions in Section 6.3 and for Section 11. Reading status: see
source_notes.md. - CH41_HAMILTON1989: Hamilton, J. D. (1989). A new approach to the economic analysis of nonstationary time series and the business cycle. Econometrica, 57(2), 357–384. Used for the HMM in Section 5 and filtering and smoothing in Section 6.6. Reading status: the reconnaissance report (R); the author did not read the full text.
- CH41_AT2012: Ang, A., & Timmermann, A. (2012). Regime changes and financial markets. Annual Review of Financial Economics, 4, 313–337. Used in Section 11 and Section 19. Reading status: reconnaissance report (R); the author did not read the full text.
- CH41_CK1986: Connor, G., & Korajczyk, R. A. (1986). Performance measurement with the arbitrage pricing theory. Journal of Financial Economics, 15(3), 373–394. Used in Section 19. Reading status: abstract only.
- CH41_VL2010: von Luxburg, U. (2010). Clustering stability: an overview. Foundations and Trends in Machine Learning, 2(3), 235–274. Used for cluster stability in Section 5 and Section 19. Reading status: reconnaissance report (R); the author did not read the full text.
- SK_KMEANS_DOC: scikit-learn 1.9.1
KMeansandadjusted_rand_score(documentation in local source). Used for k-means and ARI in Section 5. Reading status: checked by the author against local source documentation.
Specific passages read, reader, and which sources were consulted only at abstract level are recorded in course/zh/chapters/ch41/source_notes.md.
Notebook Reader Entry
The I3 Chapter 41 notebook has 12 cells, including 6 code cells. It freshly calculates the hand example, four PCA combinations, variance versus prediction, a 3,000-day state path, and the D11 post hoc diagnostic over seeds 4200–4249; it writes two new figures to a new RUN_DIR. It is not a frozen replay. This diagnostic is not promoted to a preregistered primary result. The notebook's bilingual projection is handled by BIL23; this batch did not run or modify the notebook.