CHAPTER 44/ 45
Stochastic Calculus and Derivatives
Yuxiao Ma · Advanced. Thread: start with no-arbitrage replication, build continuous pricing from available information and Itô quadratic variation, then check its boundaries through numerical results and cash ledgers.
1. Learning objectives
This chapter follows a European option from discrete replication to continuous replication, then checks analytical formulas, trees, and simulation against one another. You should be able to explain the origin of the Itô second-order term, construct a left-point integral for a specified information set, distinguish the physical measure from the pricing measure, and recompute a discrete hedging ledger with dividends and financing row by row.
The assessment actions are to calculate the stock and bond positions in one-period replication; derive the Black–Scholes PDE with continuous dividends; compute call and put Greeks in consistent units; distinguish MC sampling error, Euler discretization bias, and discrete hedging error; and use a payoff kink, an invalid tree probability, or a future-information counterexample to explain when an algorithm fails. Each action has exercises and full solutions in this chapter. Every experiment is labeled SIMULATED or CONSTRUCTED.
The level is Advanced. Prerequisites are Chapter 4 on Taylor expansions and partial derivatives, Chapter 6 on conditional expectations and normal/lognormal distributions, Chapter 9 on constraints and dimensions, Chapter 10 on contracts and payoffs, and Chapter 11 on price returns and total returns. Chapters 34–36 supply the boundaries concerning executable prices and costs. Ordinary equity alpha research follows its existing route and does not require completing stochastic calculus first.
2. Why a quant needs this
An investor forecasting next year's stock appreciation and a desk quoting a European call face different tasks. Forecasting estimates the physical distribution. No-arbitrage pricing seeks stock and cash positions whose payoff matches the option. If two portfolios have the same payoff in every model state, their current prices in an ideal market must agree; otherwise one could buy the cheaper portfolio and sell the dearer one.
A discrete tree uses two states to solve two equations. A continuous model has infinitely many paths. Adjusting the stock position to cancel instantaneous random risk requires calculating changes in functions of those paths. Brownian paths have no ordinary derivative, and the ordinary chain rule misses an accumulated second-order term. This is the concrete reason stochastic calculus enters continuous replication.
A pricing model also supplies risk sensitivities. A Delta hedger needs today's stock position, the next rebalancing time, and the cash effect of trading. A return forecaster needs the physical drift and sample evidence. Treating a risk-neutral distribution as a future-return forecast turns a pricing calculation into a purported trading signal.
3. Intuition: solve the replicating positions in two states
Teaching construction: the current stock price and European call strike are both 100. In one year the stock can only be 120 or 80; cash grows by a factor of 1.05, and there are no dividends. The option pays 20 or 0. Holding Δ shares and a current cash amount A requires both equations:
Subtracting gives 40Δ=20, hence Δ=0.5. Substitution in the down state gives A=−40/1.05. Negative cash means borrowing. In the up state, stock worth 60 minus debt of 40 leaves 20; in the down state, stock worth 40 minus debt of 40 leaves 0. Replication costs 50−40/1.05. No physical up probability is needed.
Choose an auxiliary probability p that makes the stock's expected growth factor 1.05: 1.2p+0.8(1−p)=1.05, so p=0.625. Weighting the option payoffs by this probability and dividing by 1.05 gives the same replication cost. This p comes from replication and discounting. The physical up probability could be 0.3 or 0.8 without changing the algebra. A multiperiod tree solves the replicating positions again at each node; its continuous limit becomes a predictable dynamic holding.
This tree permits only two states, no costs, and a common borrowing/lending rate. An additional independent risk state with only stock and a bond may prevent replication of every payoff. With dividends, price changes must be combined with cash received by the holder. The GBM model below retains one Brownian risk, continuous trading, and ideal financing, then checks the errors caused by discrete execution.
4. Mathematical foundations, units, and the information contract
Fix maturity T, current calendar time t, and remaining maturity τ=T−t, all measured in years. S is the ex-dividend stock price, K the strike, and V the value of an option on one share, all in the same quote currency. An actual contract multiplier is applied to the final amount; this chapter does not assume 100 shares. The continuously compounded annual risk-free rate and continuous dividend yield are r and q. Annualized volatility σ has dimension
Brownian increments satisfy
The market price of risk
Here
Every strategy holding is determined at grid left endpoint available_at, signal_time, submission, matching, and trade_time. An offline array calculation cannot establish instantaneous execution. Filtration and adaptedness below express “information then available” mathematically.
5. Formal definitions: from random paths to available information
5.1 Random-walk scaling and Brownian motion
Divide one year into N intervals, Δt=1/N, and let independent fair coins
Standard Brownian motion has
The difference quotient obeys
5.2 Information, conditional expectation, and martingales
A filtration
Conditional expectation Y=
Make information concrete with four equally likely terminal states. Independent fair ±1 coins ξ and η are revealed in that order. Set
| Terminal state (ξ,η) | Probability | |||||
|---|---|---|---|---|---|---|
| (+1,+1) | 1/4 | All four states | Two states with ξ=+1 | This terminal state | +1 | 2 |
| (+1,−1) | 1/4 | All four states | Two states with ξ=+1 | This terminal state | +1 | 0 |
| (−1,+1) | 1/4 | All four states | Two states with ξ=−1 | This terminal state | −1 | 0 |
| (−1,−1) | 1/4 | All four states | Two states with ξ=−1 | This terminal state | −1 | −2 |
Strictly,
A finite-horizon counterexample uses t=0,1,2 and a fair ±1 coin ξ:
5.3 Quadratic variation and the domain of the Itô integral
Total variation is
For the convergence needed here,
Start with a left-point simple process:
On this domain the Itô integral is a square-integrable martingale starting at 0. In particular
5.4 SDEs, GBM, and the pricing model
A stochastic differential equation (SDE),
The full equation, for every t, is
| Integral | What accumulates | Conditions and units used here |
|---|---|---|
| Time integral ∫a du | Drift times elapsed time | Locally integrable along the path; a has X units/year |
| Stochastic integral ∫b dW | L² limit of currently known coefficients times future Brownian increments | Progressively measurable/predictable with finite |
The second term does not first compute an ordinary dW/du and then integrate it. The dX in SDE shorthand cannot simply be separated by ordinary differential rules. The logarithmic transformation below must retain the Itô second-order term.
A European option pays
6. Derivations: integrals, measures, and replication prices
6.1 Why the left-point integral has a second-order correction
For any finite sequence,
This is an exact finite algebraic identity. Taking the L² limit of
The simple-process proof of the isometry expands term by term. Cross terms i<j in
6.2 Itô's formula: which Taylor terms survive accumulation?
To see the increments, first expand for sufficiently smooth functions and locally bounded coefficients, evaluating all derivatives at the left endpoint:
Second-order time terms and time-space cross terms disappear in the accumulated limit; the squared space term survives. Writing
Why random left-point weights still permit replacement of squared increments. Fix a deterministic partition
For i<j,
Thus
For the smooth functions here, stopping within a compact region bounds the coefficient/derivative weights; localization then handles leaving that region. This connects the bounded calculation to the general Itô formula, without presenting the short bound as a full remainder proof. The conclusion is for deterministic partitions and does not extend here to arbitrary path-dependent random partitions.
For
The Taylor argument explains the second-order term. The general theorem for
For f=x², a=0, b=1, we have
6.3 Explicit ABM/GBM solutions, moments, and discretization error
Arithmetic Brownian motion (ABM) writes dX=a dt+b dW with local symbols a in X units/year and b in X units/√year. Direct integration gives
Geometric Brownian motion (GBM) has price drift β: dS=βSdt+σSdW. Here β is a local symbol for the price drift: β=μ−q under P and β=r−q under Q. For f(S)=log S, f'=1/S and f''=−1/S². Itô's formula gives
We can also verify the candidate explicit solution backward rather than trust ordinary separation of variables. Let
The exponential is strictly positive at finite t and finite Brownian values, so
The variable
Exact grid sampling is
Strong error compares paths driven by common noise. Here we estimate terminal
For linear GBM we can derive the population RMSE directly. Set h=T/N, single-step Euler factor X=1+βh+σΔW, and exact factor Y=exp[(β−σ²/2)h+σΔW]. Gaussian exponential moments and independent increments give
The terminal mean squared error is consequently
Expand each Nth power through N log(1+a h+b h²). Combining its first-order h coefficients yields the leading mean squared error term
Thus population RMSE for this GBM is O(√h). Expanding the two means in §6.3 directly gives a mean difference of O(h). Finite-grid plots show compatibility of sample estimates with these restricted analytical references; they do not prove convergence orders for arbitrary SDEs or payoffs.
6.4 From P to Q: constant coefficients over a finite horizon
Fix finite T and σ>0, with μ the total-return drift including dividends. Define λ=(μ−r)/σ and
Girsanov's theorem gives
Substitute
The q terms cancel in λ because μ was defined as total-return drift. This change reweights probabilities on the same path space. It does not replace real investors' expected returns with r or establish known returns under P.
6.5 The correct martingales for a dividend-paying stock
Under Q,
This is a true martingale under the finite-horizon GBM second-moment conditions here. Alternatively, reinvest dividends continuously: shares
6.6 From one-period replication to a multiperiod CRR tree
For q=0 define growth
No arbitrage requires d<R<u, making both auxiliary state weights strictly positive. The stock and bond payoff columns are linearly independent, with determinant proportional to u−d. Thus this two-state market replicates any payoff, showing how completeness appears in concrete equations.
The Cox–Ross–Rubinstein (CRR) binomial tree sets
This establishes the dividend-adjusted forward-growth relation for the tree. Price changes alone are not the total return of a dividend-paying stock. Terminal stock values are
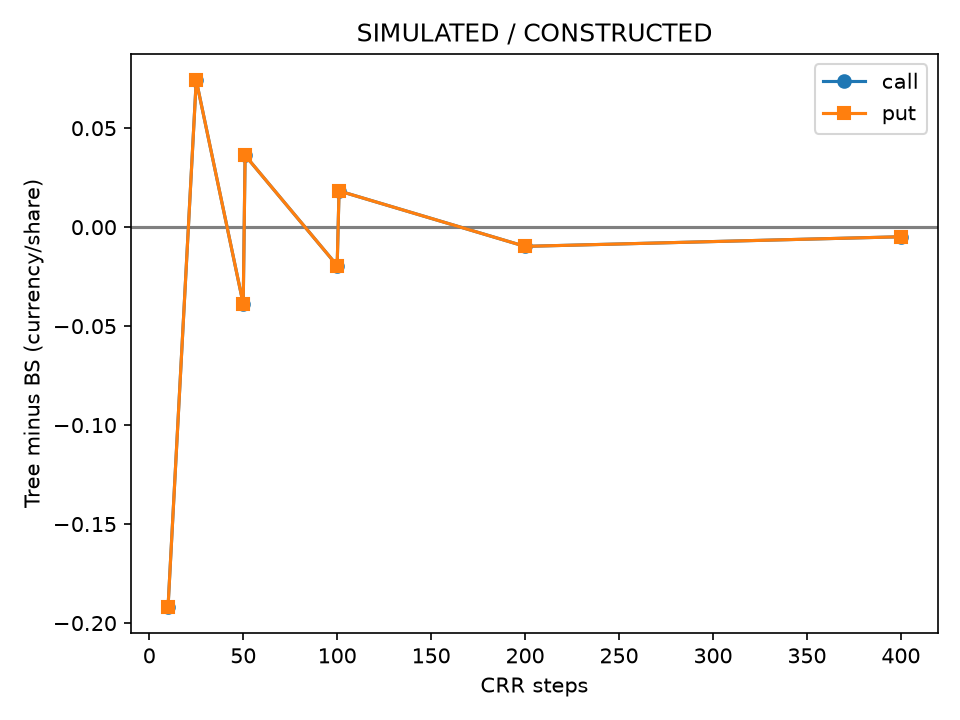
If a is not strictly inside (d,u), the two-state model fails the strict no-arbitrage requirement. Use a finer valid grid or reject explicitly. This chapter does not clip probabilities; the deterministic σ=0 boundary is handled separately. As N increases, alignment of the payoff kink with the grid changes, often producing odd/even oscillation. Smaller errors on selected grids are numerical observations, not a claim of monotone convergence for consecutive N.
6.7 Continuous self-financing replication and the Black–Scholes/Merton PDE
Replicate one European option with Δ shares and cash A, so V=ΔS+A. Self-financing means changes in Δ are paid from A with no external injection; gains arise from existing positions:
This gain equation includes dividends and financing. Applying the product rule to ΔS produces SdΔ and cross variation, which are matched by stock-rebalancing transfers in the cash account. V=ΔS+A alone does not justify treating Δ as constant indefinitely. Admissible strategies and the integral conditions here make these stochastic gain equations meaningful.
First consider instantaneous cost-free rebalancing with no interval gains. At S=100, selling 0.1 share reduces stock value by 10 currency units and raises cash by 10; ΔS+A is unchanged. The 10 is an internal transfer, not an additional gain. When the smooth pre-maturity Delta here is a semimartingale, the product formula can be written explicitly:
Adding cancels the rebalancing terms and cross variation, recovering the self-financing gain equation. Borrowed cash A accrues at the same r. Continuous dividends enter cash rather than automatically increasing shares. This expansion applies to the sufficiently smooth Delta used here; a general predictable strategy need not admit such a dΔ calculation. The general self-financing definition uses the gain integrals of existing holdings.
Under P,
The random coefficient in the replicating gain equation is σSΔ, so σS>0 requires Δ=
Subtract
The physical μ disappears because the replicating holding cancels the same Brownian risk and its drift is constrained by financing and dividends. We have not assumed μ=r. An additional independent untraded risk, jumps, or transaction costs can invalidate the original replication equation. Merton (1973), §7, equation (44) uses remaining maturity and −
Spatial boundaries are C(t,0)=0 and
A pricing map for the same payoff. Fix
| Layer | Task for the same payoff | Required basis/conditions |
|---|---|---|
| Continuous replication → PDE | Cancel the same noise and match financing drift | Self-financing, tradable risk, smooth price, admissible strategy |
| Q conditional expectation | Represent the PDE price as an expected discounted payoff | Restricted Feynman–Kac below, a true martingale, and an integrable terminal limit |
| BS Gaussian integral | Evaluate that expectation for constant-coefficient GBM | d₂ gives exercise probability; d₁ comes from a stock-weighted truncated integral |
| CRR tree / Q MC | Discrete replication / sampling calculation | Valid tree probabilities and grid error / independent pairs and SE |
Discrete hedging error on P paths checks the execution ledger within a specified model, a separate task. Q does not forecast physical stock appreciation; sharing a payoff does not imply a common P/Q drift. The next section uses bounded call/put Delta to ensure martingale conditions, with analytical verification in §6.10. The reverse route in §6.9 integrates first and checks the PDE afterward.
6.8 The Feynman–Kac link: why a Q expectation is available here
The Feynman–Kac representation connects a diffusion-generator PDE solution to a conditional expectation. Here its scope is constant r/q/σ, σ>0, positive S, finite T, continuous call/put payoffs of at most linear growth, and solutions that are
For u∈[t,T), apply Itô under Q to
The Q-GBM Markov property makes this expectation a function of current t and S alone. A local martingale does not automatically preserve its expectation as a true martingale does; the moment conditions are part of the argument. In the reverse direction, the explicit Gaussian integral below produces a smooth price that can be checked against the PDE. No unconditional assertion is made for arbitrary irregular payoffs or degenerate/discontinuous coefficients.
6.9 Deriving calls, puts, d1, and d2 by Gaussian integration
Given current S and τ, the Q terminal value is
The stock contribution requires an exponentially weighted truncated normal integral. With φ the standard normal density, completing the square gives
Define d1=d2+v, with m+v²/2=(r−q)τ. Discounting the stock and strike terms gives the Black–Scholes/Merton formula:
The quantity d2 supplies the Q exercise probability. The d1 term comes from exponential weighting of the stock payoff; Φ(d1) is not the unweighted exercise probability under that same Q. Delta will be
6.10 Greeks: define the derivatives, then cancel repeated terms
Greeks are local risk sensitivities, with other contract parameters held fixed.
Begin analytical differentiation with
Differentiating in σ makes the two CDF chain terms a common density coefficient times
The PDE provides a scenario-by-scenario check:
6.11 Monte Carlo under Q and antithetic variates
This subsection shifts the current valuation time to 0. Its T is the shifted remaining maturity, namely τ=calendar maturity−current time on the original clock. The terminal subscript T below uses that shifted clock, and API T also equals τ. At an arbitrary current t, one must not pass the unadjusted calendar maturity to MC.
Monte Carlo (MC) draws independent
Antithetic variates use each independent
The typical SE scale as sample size grows is
6.12 A discrete Delta-hedging ledger: who receives cash each interval?
Simulate the P price drift μ−q with initial capital
Let dt=T/N. Hold the previous post-rebalance shares
Continuous-model cash dividends are
Observe
At maturity force
7. Financial Interpretation: Prices, Probabilities, and Hedging Cash
Stock price changes must be distinguished from total stock returns. Holding Δ shares produces dividend income of ΔqSdt; the borrowing balance accrues interest at rate r. If dividends are omitted from the replication ledger, the stock term in the PDE is incorrectly written as r instead of r−q, and call and put prices and Deltas will then be inconsistent. Two pricing algorithms can be compared only when they use the same payoff, financing, and allocation of cash flows.
Monte Carlo pricing computes expectations under Q. The discrete hedging experiment instead sets μ=.08, including dividends, under P to examine the error along the specified model paths. The two experiments share r, q, σ, and the payoff, but differ in purpose, measure, and drift. Hedging error is defined as the cash remaining after liquidation minus the option payoff. A positive value means the replicating portfolio has excess cash; a negative value means it is short of the required cash. This is not the investment return from holding one option.
Frictionless continuous replication provides a model benchmark. Discrete rebalancing leaves Gamma risk, and approximating dividends and cash flows over intervals introduces error. More frequent rebalancing also increases fees. The 10 bp fee is a constructed input; it has not been checked against order-book quotes or estimated market impact. Connecting the hedging chart to real profitability would still require validation of quotes, latency, borrowing, jump risk, and data permissions.
8. Numerical Example: Frozen European Pricing and Hedging Experiment
All results are SIMULATED / CONSTRUCTED, with each payoff corresponding to one share. Inputs are build/batches/A9-A/r1/runs/experiment_output_02 and has since been archived. Original run identities are recorded in the archive inventory. The numbers below retain the accepted historical independent root run; its existing results.json is available separately. The existing root results and archived author run retain distinct identities. This bilingual batch neither reran the experiment nor extracted the archive. All amounts are per-share teaching amounts in the same currency.
8.1 Intermediate Values for the Hand Calculation and Analytic Price
For the one-period tree without dividends, the replicating position is .5 shares and cash of −38.0952380952, giving a price of 11.9047619048. The up-state payoff is 20, the down-state payoff is 0, and the auxiliary probability is p=.625, matching the equation in §3. Its multipliers 1.2/.8 and growth factor 1.05 differ from those of the main CRR grid, so the difference between their prices must not be called an algorithm error.
For the main example, log(S/K)=0, (r−q+σ²/2)T=.05, and σ√T=.2, so d1=.25 and d2=.05. The discounted stock amount is
8.2 CRR and Analytic Price Comparison
| Steps | call | put | call−BS |
|---|---|---|---|
| 10 | 9.03532574 | 6.13840086 | -0.19167977 |
| 25 | 9.30117882 | 6.40425394 | +0.07417331 |
| 50 | 9.18822483 | 6.29129994 | -0.03878068 |
| 51 | 9.26328514 | 6.36636025 | +0.03627963 |
| 100 | 9.20758997 | 6.31066509 | -0.01941554 |
| 101 | 9.24530483 | 6.34837995 | +0.01829933 |
| 200 | 9.21729155 | 6.32036667 | -0.00971396 |
| 400 | 9.22214700 | 6.32522212 | -0.00485851 |
The 25/50/51 and 100/101 grids show the effects of parity and payoff-grid alignment. Call and put errors overlap in the chart because of parity in this model. Valid probabilities are rechecked as the step size changes; connecting lines are only for reading adjacent choices. No claim of monotone convergence is made.
8.3 Exact Terminal-Value Monte Carlo under Q
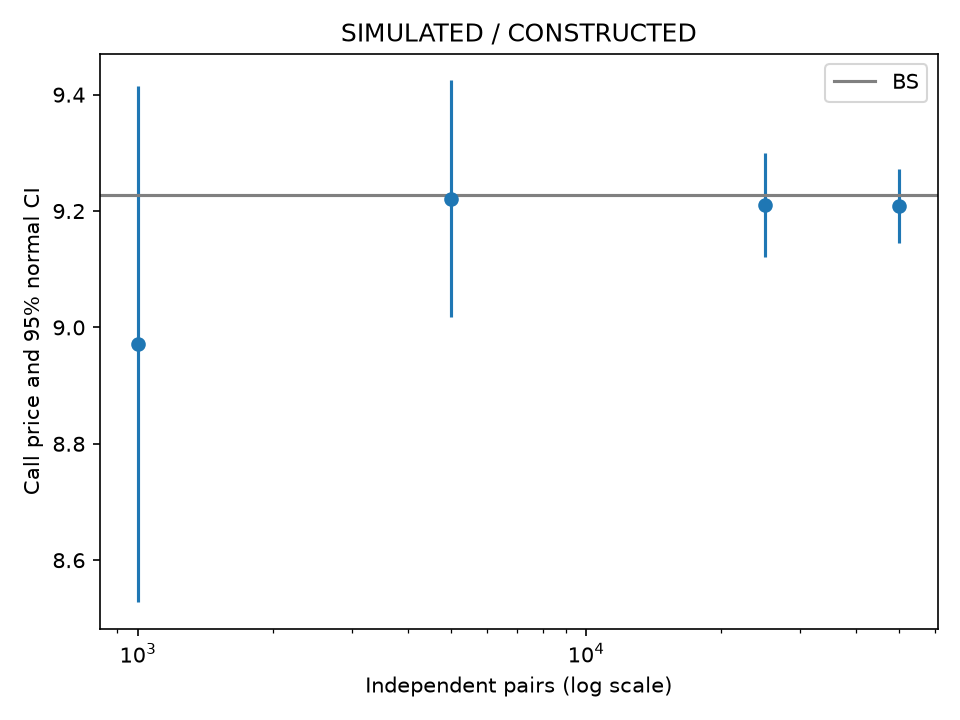
Seed 4401. For antithetic sampling, the independent unit is the pair mean. Each row uses M independent pairs and 2M terminal payoff calculations; the 95% interval is a normal approximation.
| Type | Independent pairs M | Price | SE | Approximate 95% CI |
|---|---|---|---|---|
| call | 1000 | 8.970967 | 0.226342 | [8.527344, 9.414590] |
| put | 1000 | 6.168817 | 0.144720 | [5.885170, 6.452464] |
| call | 5000 | 9.221358 | 0.103914 | [9.017691, 9.425026] |
| put | 5000 | 6.322140 | 0.066202 | [6.192386, 6.451894] |
| call | 25000 | 9.210317 | 0.045884 | [9.120386, 9.300248] |
| put | 25000 | 6.322468 | 0.029532 | [6.264586, 6.380350] |
| call | 50000 | 9.208583 | 0.032531 | [9.144823, 9.272343] |
| put | 50000 | 6.318800 | 0.020913 | [6.277811, 6.359790] |
For 50000 ordinary independent paths, the call SE is 0.061862; for the same number of independent pairs, the SE is 0.032531. The number of payoff calculations differs, so this is not a comparison at equal computational cost. A single interval covering the analytic price does not prove the algorithm is correct, and the error need not decrease monotonically each time M increases.
8.4 Finite-Grid Brownian Quadratic Variation and Its Limit
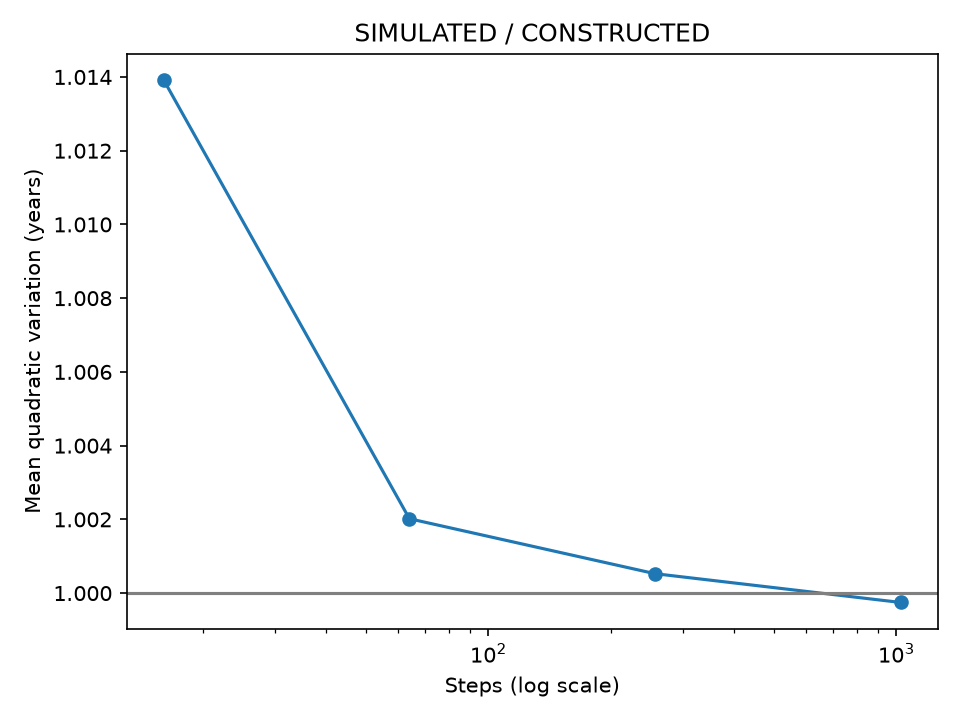
Seed 4402, with 1024 fine increments on each of 1024 paths, aggregated into nested grids; T=1.
| Steps | Sample mean QV | Sample SD of QV | Maximum finite-identity residual | RMSE relative to Itô limit |
|---|---|---|---|---|
| 16 | 1.013915 | 0.355776 | 6.66e-16 | 0.177937 |
| 64 | 1.002018 | 0.174564 | 4.44e-16 | 0.087245 |
| 256 | 1.000527 | 0.089581 | 8.88e-16 | 0.044769 |
| 1024 | 0.999746 | 0.045050 | 8.88e-16 | 0.022514 |
Each finite identity uses the actual QV for that row; only the last column replaces QV with its theoretical limit T. The sample means and SDs are compared with the theoretical values
8.5 Exact GBM and Euler under P with Shared Increments
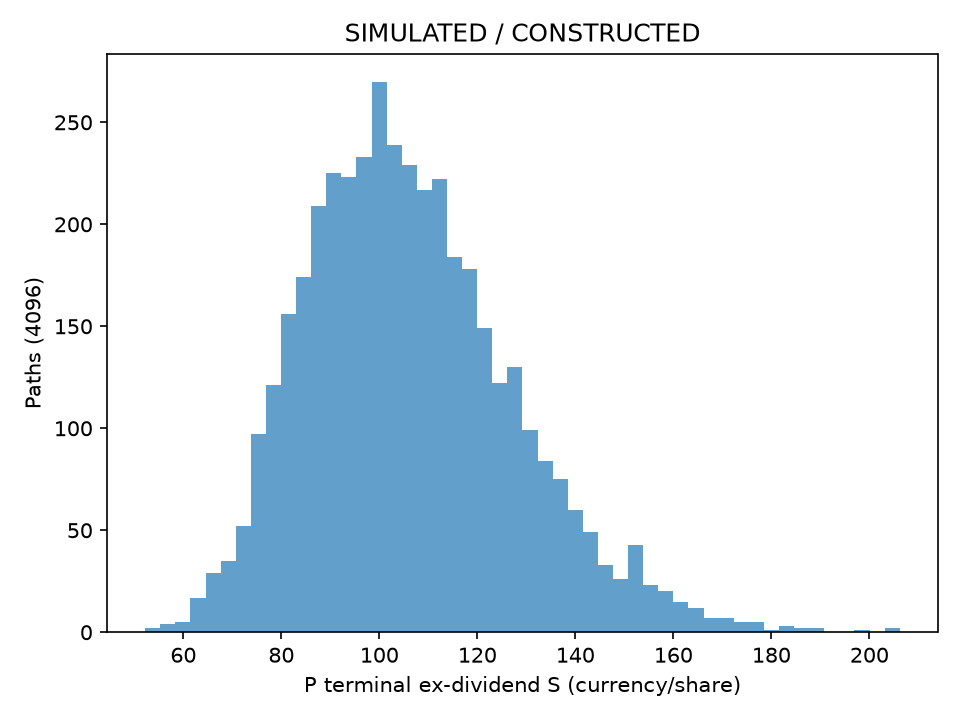
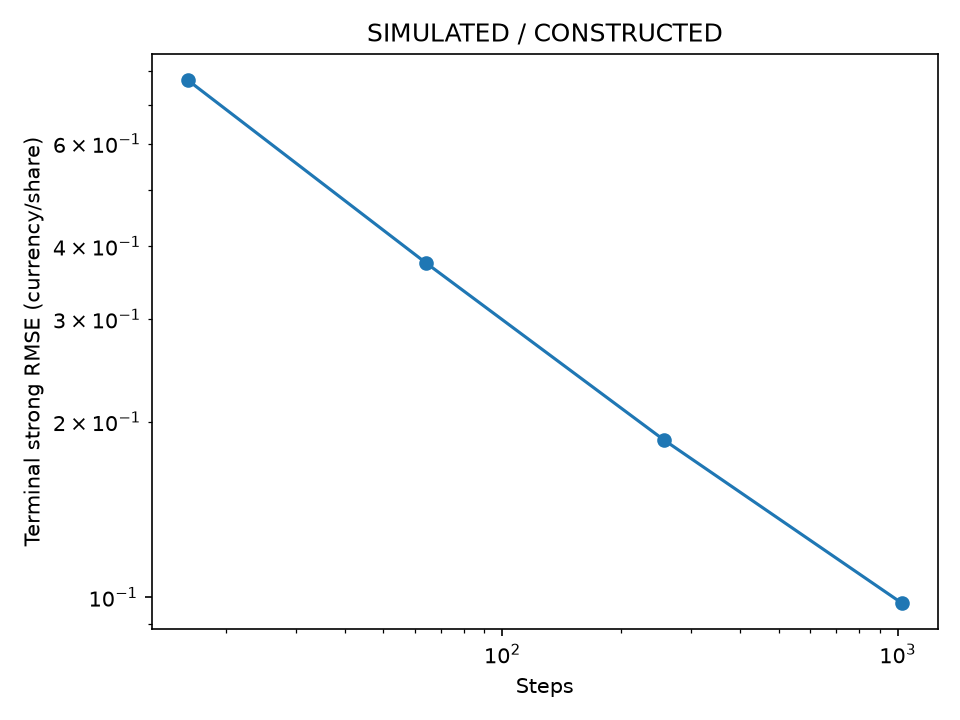
Seed 4403, with 4096 fine paths, dividend-inclusive μ=.08, and stock-price drift .06. Strong error uses the terminal difference D along the same Brownian path; the weak difference is the signed mean(D), and the paired SE is reported.
| Steps | Strong RMSE | Paired weak mean difference | Paired SE | Population mean difference |
|---|---|---|---|---|
| 16 | 0.770766 | -0.024165 | 0.012039 | -0.011915 |
| 64 | 0.374745 | -0.002197 | 0.005856 | -0.002985 |
| 256 | 0.186236 | -0.000825 | 0.002910 | -0.000746 |
| 1024 | 0.097747 | -0.002740 | 0.001527 | -0.000187 |
The strong-error scale on finer grids is consistent with Euler's strong order 1/2. The weak sample difference is larger at 1024 steps than at 256; the paired SE explains why monotonicity is not required. For the exact model,
8.6 Greeks and Step Size
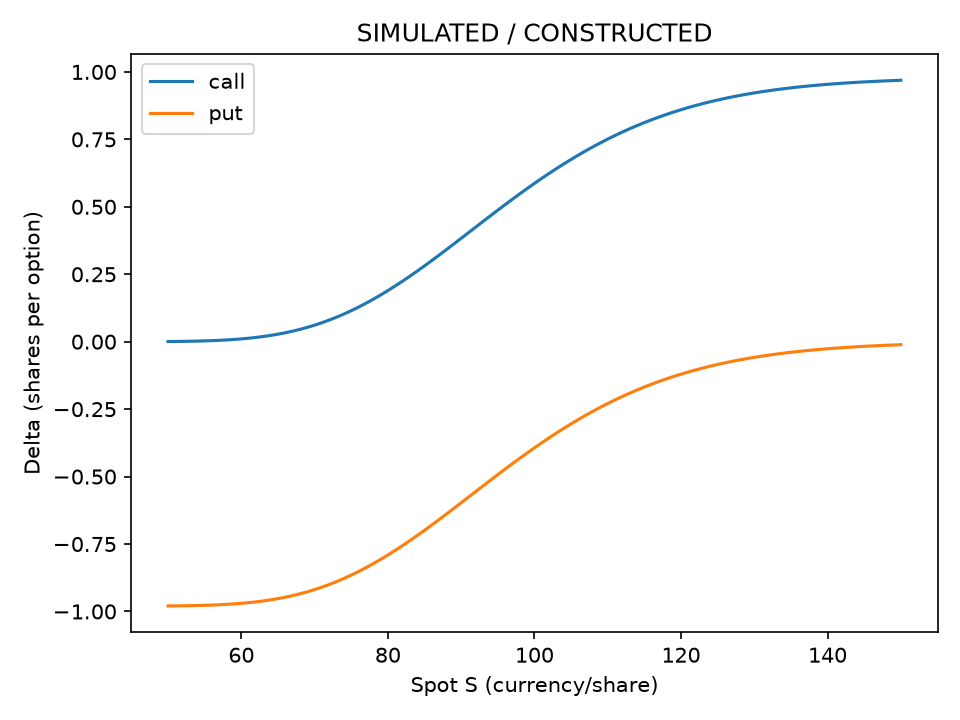
Vega and Rho are reported per unit parameter change; Theta is per calendar year. Centered differences were checked for calls and puts at S=80/100/120 with other inputs fixed. The maximum absolute error across different units is only an execution summary of per-item tolerances; it should not be treated as a single economic distance.
| S/type | Delta | Gamma | Vega | Theta | Rho |
|---|---|---|---|---|---|
| 80/call | 0.189494 | 0.016802 | 21.506484 | -2.528897 | 13.628799 |
| 80/put | -0.790704 | 0.016802 | 21.506484 | 0.658932 | -81.494143 |
| 100/call | 0.586851 | 0.018951 | 37.901158 | -5.089319 | 49.458109 |
| 100/put | -0.393348 | 0.018951 | 37.901158 | -2.293569 | -45.664833 |
| 120/call | 0.859931 | 0.008299 | 23.900201 | -4.282714 | 79.130557 |
| 120/put | -0.120268 | 0.008299 | 23.900201 | -1.879044 | -15.992386 |
For every scenario and metric, the absolute centered-difference error is below 2.2e−6 in its own units, with h=.0001 and stock-price step
| h ratio | Gamma difference | Gamma error |
|---|---|---|
| 1e-02 | 0.0189477855 | -2.79e-06 |
| 1e-04 | 0.0189505786 | -1.20e-10 |
| 1e-06 | 0.0189515958 | +1.02e-06 |
| 1e-08 | 0.0355271368 | +1.66e-02 |
The very small h=1e−8 has already lost accuracy; the source code retains this negative diagnostic.
8.7 Discrete Delta Hedging under P and Fees
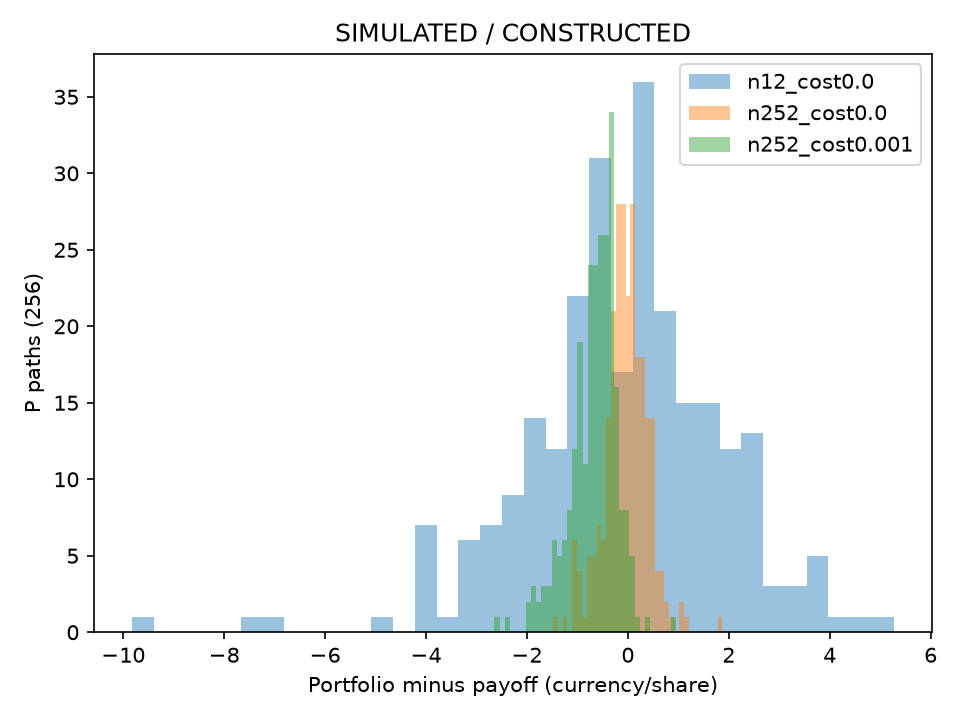
Seed 4404, with 256 shared Brownian paths of 3276 fine steps, aggregated to 12/52/252 steps. The P stock-price drift μ−q=.06 is distinguished from the Q pricing drift .03. fee=.001 is a one-sided 10 bp fee, charged at initiation and liquidation; amounts are per share.
| Steps/fee rate | Mean error | SD | 5th percentile | 95th percentile | Mean cash fee |
|---|---|---|---|---|---|
| 12/0.0 | -0.100174 | 1.982914 | -3.299152 | +2.940812 | 0.000000 |
| 12/0.001 | -0.332425 | 2.000768 | -3.551955 | +2.751658 | 0.226679 |
| 52/0.0 | -0.053391 | 0.952187 | -1.694724 | +1.431930 | 0.000000 |
| 52/0.001 | -0.404548 | 0.977735 | -2.202883 | +1.122840 | 0.342607 |
| 252/0.0 | -0.042639 | 0.432230 | -0.786323 | +0.580357 | 0.000000 |
| 252/0.001 | -0.669815 | 0.476814 | -1.561916 | -0.039341 | 0.611734 |
Without fees, higher frequency lowers the error SD in this sample. With fees, higher frequency produces a more negative mean and larger average fees; the 95th percentile is also negative at 252 steps. This comparison retains replication shortfall and fees and does not promise real-world profitability at any frequency. The difference in mean error includes fee financing drag; total fees are a nominal sum.
8.8 Cash and Share Reconciliation in a Complete Ledger
Path 0, 12 steps, fee=.001, with time i/12 years. The tables separate cash flows on the old position from the current rebalance. Unrounded values from the existing independent root run are in ledger_n12_cost0.001.json; the archived author payload is separately indexed above. Use the actual floating-point values to reconcile the ledger with the code in §18 rather than requiring 1e−10 agreement from six-digit displayed values.
| i | S | New shares | Interval interest | Interval dividend | Rebalance cash flow |
|---|---|---|---|---|---|
| 0 | 100.000000 | 0.586851 | 0.000000 | 0.000000 | -58.685115 |
| 1 | 93.634880 | 0.450214 | -0.206750 | 0.097890 | 12.793965 |
| 2 | 92.185735 | 0.407093 | -0.153839 | 0.070318 | 3.975204 |
| 3 | 96.449460 | 0.495617 | -0.137606 | 0.062599 | -8.538091 |
| 4 | 98.288381 | 0.532052 | -0.173605 | 0.079736 | -3.581155 |
| 5 | 100.746167 | 0.587785 | -0.188964 | 0.087230 | -5.614901 |
| 6 | 108.452054 | 0.765829 | -0.212857 | 0.098777 | -19.309250 |
| 7 | 119.086899 | 0.927286 | -0.294037 | 0.138542 | -19.227440 |
| 8 | 119.499826 | 0.947869 | -0.375048 | 0.184200 | -2.459650 |
| 9 | 118.440463 | 0.960607 | -0.386125 | 0.188941 | -1.508684 |
| 10 | 130.009165 | 0.996218 | -0.393254 | 0.189783 | -4.629671 |
| 11 | 152.859291 | 0.998335 | -0.413453 | 0.216042 | -0.323635 |
| 12 | 149.238140 | 0.000000 | -0.415630 | 0.254553 | 148.989617 |
| i | Fee | New cash | Stock market value | Portfolio value | Option value/terminal payoff |
|---|---|---|---|---|---|
| 0 | 0.058685 | -49.516794 | 58.685115 | 9.168320 | 9.227006 |
| 1 | 0.012794 | -36.844483 | 42.155771 | 5.311288 | 5.497746 |
| 2 | 0.003975 | -32.956775 | 37.528141 | 4.571366 | 4.476903 |
| 3 | 0.008538 | -41.578412 | 47.801964 | 6.223552 | 5.969667 |
| 4 | 0.003581 | -45.257016 | 52.294519 | 7.037502 | 6.436110 |
| 5 | 0.005615 | -50.979266 | 59.217090 | 8.237823 | 7.293182 |
| 6 | 0.019309 | -70.421905 | 83.055745 | 12.633839 | 11.978397 |
| 7 | 0.019227 | -89.824067 | 110.427659 | 20.603591 | 20.615407 |
| 8 | 0.002460 | -92.477026 | 113.270211 | 20.793186 | 20.628805 |
| 9 | 0.001509 | -94.184402 | 113.774758 | 19.590356 | 19.258906 |
| 10 | 0.004630 | -99.022174 | 129.517407 | 30.495233 | 30.407686 |
| 11 | 0.000324 | -99.543544 | 152.604737 | 53.061194 | 53.020537 |
| 12 | 0.148990 | 49.136007 | 0.000000 | 49.136007 | 49.238140 |
Initial cash equals the model price minus the stock purchase and initial fee. Over each interval, the carried share position receives dividends. On the final row, the share count and stock market value are zero, and liquidation cash minus payoff is the path error. Cash fees and financing costs reduce replication funds even when the terminal stock path is unchanged.
9. Python Implementation
Throughout this section, the public pricing parameter T denotes remaining time to maturity τ, in years. For example, if calendar time t=.25 and maturity
Core calculations are in src/quant_course/stochastic_calculus.py and derivatives_pricing.py, and are reused by the CLI and Notebook. Run the CLI from the course root using the existing .venv. All prices are in currency per share. The output directory must not already exist; if a run fails, retain that directory and continue with a new path.
.venv/bin/python code/ch44_stochastic_derivatives.py \
  --output-dir runs/reader_01
.venv/bin/python -m pytest \
  tests/test_stochastic_calculus.py tests/test_derivatives_pricing.py \
  tests/test_ch44_root.py -q
The CLI records fixed seeds, Monte Carlo pricing under Q and hedging under P, analytic/tree errors, Greek finite differences, shared Brownian increments, error estimators for every grid, figures, and one complete cash ledger. Run the Notebook from a clean kernel in first-cell order; it calls the core functions and generates PNGs during execution. Its smaller demonstration does not replace the full frozen CLI experiment.
Public pricing functions reject NaN, infinity, non-positive S/K, negative σ/T, and invalid call/put types; r may be negative. The tree rejects invalid probabilities rather than clipping them to 0 or 1. Prices at expiry and at zero volatility use the deterministic payoff. The Greeks API supports T>0 and σ>0; it explicitly rejects inputs at expiry or with zero volatility. At the payoff kink there is no ordinary unique derivative, while some deterministic derivatives can exist away from the kink; this API does not provide them. If extreme parameters exceed floating-point range, the function should raise a clear error rather than return a seemingly valid NaN.
The left-point integration function checks dimensions, shapes, and finite values; it cannot infer the information source of a numerical array. The caller is responsible for proving the integrand is adapted. The GBM function's drift is directly the stock-price drift: pass μ−q=.06 under P or r−q=.03 under Q; the function does not subtract q again.
10. Visualization
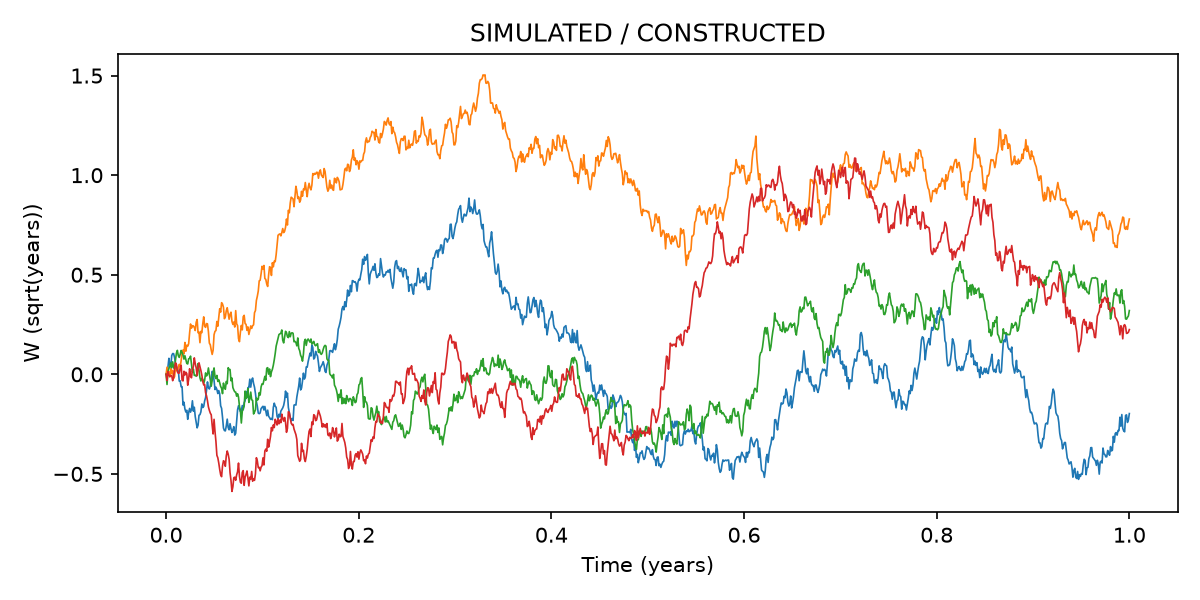
The eight generated figures are placed beside the corresponding numerical results in §8, so reading the charts stays connected to the calculations. Inputs, units, random seeds, and sample sizes are described with each figure; the SIMULATED label appears on the charts. Brownian connecting lines do not imply smooth paths, the gray QV line is the population limit, tree-error connecting lines do not imply monotonicity, Monte Carlo error bars are sampling intervals, the Delta curve shows local model sensitivity, and the hedging histogram is under P rather than Q.
The figures can be rebuilt by the standalone CLI in a new directory; retain the output results together with the PNGs.
11. Real Market Example: A Testable Question from the Model
This chapter did not download a real option chain or report real market quotes and model-price differences. Agreement among the three pricing methods inside the model therefore checks only the numerical implementation and the relationship under the stated assumptions. With permission to use the data, you could ask a vendor a practical question: for the same underlying, expiry, strike, currency, timestamp, bid/ask quotes, and dividend curve, compute the implied volatility for each valid quote and test whether a single constant σ can explain them.
A volatility smile or skew means that implied volatility varies with contract characteristics such as strike. It is a pattern in model parameters backed out from prices, not an observed return distribution under the real-world measure, and it cannot be directly interpreted as trading Alpha. Before inverting mid-prices, check the bid/ask range, payoff convention, and dividends. If a constant-σ model shows systematic differences across many strikes, stochastic volatility, local volatility, or jump models may be needed; their hedging performance would still need to be tested.
The original Black–Scholes paper assumes no dividends and no transaction fees; Merton's dividend extension supports the q term in this chapter. Those theoretical sources do not mean that this chapter replicated their market studies. The real-market example remains pending validation with licensed data. Missing evidence includes quote URLs and permissions, download date and version, sample period, synchronized quotes and execution latency, currency-consistent rates and dividends, hashes, and reproducible cleaning. This chapter does not invent a volatility surface or market prices to fill that evidence table.
12. Common Mistakes: Runnable Counterexamples for Diagnosis
Mistake 1: Treating a Brownian path as an ordinary smooth path and calculating
Mistake 2: Copying the terminal value
Mistake 3: Replacing r−q under Q with μ−q under P and then discounting at r. This computes a discounted expectation under P and generally does not replicate a European payoff. 44-P03 computes both the correct Q model and the incorrect drift construction for comparison; the role of Q follows from the model's assumptions of σ>0, completeness, and no arbitrage.
Mistake 4: Calculating the SE for correlated antithetic paths as though there were 2M independent samples. In 44-P04, both payoffs are generated from the same z and averaged within each pair first; the correct SE comes from the sample variance of the M pair means. The direction of error in the incorrect SE depends on payoff correlation; this chapter's example must not be stated as a theorem that antithetics reduce SE for every payoff.
Mistake 5: Treating Vega itself as the price change for a one-percentage-point volatility move, or treating Theta with respect to remaining time as Theta with respect to calendar time. 44-P04 provides centered differences in matching units and the 1 pp conversion. A step size that is too small can make Gamma inaccurate through cancellation; one that is too large introduces truncation error. More displayed decimal places do not guarantee greater accuracy.
Mistake 6: Recording only stock rebalancing in the hedging ledger, omitting interest on existing cash or dividends on the existing stock position, or retroactively crediting past dividends using the new Delta. 44-P05 recomputes the old position's interval cash flows, current rebalance, and initial and liquidation fees row by row; it also shows the difference between the incorrect and correct ledgers. Using a future Delta or omitting fees changes the financial task.
13. Quant Research Application: From Model Checks to a Data Experiment
A research question could be: “Does increasing discrete hedging frequency reduce replication-loss risk after fees?” First fix the underlying/payoff and the sign convention for the error. Use frictionless continuous replication as the benchmark, then freeze the candidate frequencies, one-sided fee, P-path parameters, sample size, and seed. This chapter first examines sensitivity inside the model and retains the mean, SD, percentiles, and fees. A smaller error under one seed does not show that another market environment will behave better.
For real data, split the timeline into an estimation period for volatility, dividends, and fees, and a later period that is evaluated only once. This ensures every hedge uses only information available at that time. Record each bid/ask and execution eligibility, cash rates and borrowing spreads, settle the same fixed payoff, and compare with simple baselines such as no hedge, fixed Delta, and low-frequency Delta. Report pricing error, hedging risk, and net trading-strategy return separately.
Specify possible disconfirming outcomes in advance: a constant σ cannot explain the quote range; jump or tail replication shortfall exceeds the risk limit; fees from higher frequency offset the error reduction; or synchronized/licensed data are insufficient for reproduction. Any of these could prompt a revision to the model or execution assumptions. If parameters are changed after viewing the later period, label the analysis post hoc rather than rewriting it as preregistered. The results in this chapter deliver only the simulated teaching candidate described above, not a completed real-derivatives project acceptance.
14. Chapter Summary
The two-state replication equations give the risk-neutral probability; the information set constrains usable dynamic positions; Brownian quadratic variation explains the second-order Itô term; and GBM combines these conditions into a positive-price path. Continuous self-financing replication eliminates the real-world drift and leaves a PDE involving r, q, and σ. The risk-neutral conditional expectation connects the analytic solution to numerical methods.
In practice, first check the payoff and units, then the model and information conditions, and then choose the analytic formula, tree, or Monte Carlo method. Check Greeks with finite differences, calculate SE using the independent sampling unit, and check hedging error with a complete cash ledger. Numerical agreement supports the implementation; real quotes, costs, and jumps still determine the model's application boundary.
15. Exercises
44-E01: Scaling and the Scope of the Proof
For a fair-coin random walk over one year with N steps, let the step size be either ξ/√N or ξ/N. Find the terminal variance in each case. What distribution does a Brownian difference quotient follow? Explain why this rules out a finite derivative in probability at a fixed time, and why it does not by itself prove almost-sure nondifferentiability everywhere. Derive the expected QV and its variance bound for a deterministic grid.
44-E02: Zero Unconditional Mean Does Not Imply a Martingale
Let ξ be fair ±1 and define
44-E03: Finite Grid and Limit
For the path W=[0,.2,.1,.4], calculate the sum of squared increments, the left-point sum, and the right-point sum. Use telescoping sums to derive the general expressions for both sums. For Brownian motion with T=1, explain which equality holds only in the limit when QV is replaced by 1.
44-E04: GBM and Common Noise
Under P, let μ=.08, q=.02, σ=.2, and
44-E05: Measure Change and Dividend-Adjusted Martingales
With the same parameters and r=.05, find λ,
44-E06: One-Period Replication
Let
44-E07: Self-Financing and the PDE
Starting from V=ΔS+A, the dividend-financing flow in dA, and Itô's formula for dV, derive the PDE including q term by term. Explain why applying the ordinary product rule directly to ΔS would incorrectly treat rebalancing as an external contribution. State the European call/put terminal payoff and the σ>0 domain, as well as the borrowing and trading assumptions.
44-E08: d1/d2 and Conditional Pricing
Starting from the normally distributed log terminal price under Q, separately integrate
44-E09: Greek Units
Define Delta, Gamma, Vega, Theta, and Rho, with Theta measured in calendar time and Vega/Rho per unit parameter change. State the q-inclusive analytic relationships for calls and puts. How is a 1 pp volatility shock converted? Is the ordinary Delta unique at expiry when S=K? Why can a very small centered-difference step become inaccurate?
44-E10: Standard Error for Antithetic Monte Carlo
Given M independent
44-E11: Information Groups and Weighted Quadratic Variation (New)
Using the four-terminal-state table in §5.2, fill in
44-E12: Cash Transfer, Explicit Solution, and Time Convention (New)
With S=100, zero fees, and no interval return, let the share position change from .6 to .5 while cash is A=−50. Calculate total value before and after rebalancing term by term. Write the cash-offset identity for a smooth Delta in this chapter. For the explicit GBM solution, write
16. Programming Exercises
44-P01: Finite Integral and Information Diagnostics
Generate 16 Brownian paths with 1024 steps using seed 4402. Check the maximum residual in the finite identity, the difference from the T limit, and that changing a future suffix does not affect the first-half integral. Then calculate the anticipating sum H=
44-P02: Nested Common Increments
Following the frozen protocol, aggregate 4096 fine paths of 1024 increments to grids of 16/64/256/1024 steps. Calculate the strong terminal RMSE between exact GBM and Euler, the paired weak mean difference and SE, and compare the analytic Euler mean with the exact mean. If independent noise is incorrectly used for the comparison, state what quantity the difference estimates. Do not use monotonicity of the weak sample mean as an acceptance criterion.
44-P03: Three Prices and Rejection Boundaries
Check the base call/put, parity, multiple CRR grids, and Monte Carlo with Q drift. Construct the incorrect discounted expectation that uses μ−q=.06 and compare amounts using the same z. Test that invalid tree probabilities are rejected rather than clipped, negative rates are allowed, and prices at expiry/zero volatility are correct.
44-P04: Greeks and Correlated-Sample SE
For calls and puts at S=80/100/120, perform centered differences in matching units and scan Gamma error at h=.01/.0001/.000001/.00000001. Using 1000 independent z values with seed 4401, recompute the antithetic pair SE and the incorrect flattened SE and report both. The Greeks API must explicitly reject T=0/σ=0; with one independent random Monte Carlo observation, SE cannot be estimated and must be rejected.
44-P05: Reconcile the Hedging Ledger Row by Row
For the path [100,110,105,90], recompute each row for a one-year, three-step call with r=.05, q=.02, σ=.2, K=100, and fee=.001: financing on old cash, dividends on old shares, the number of shares and cash flow at rebalancing, one-sided fees, new cash, stock market value, final liquidation, and the payoff difference. Reconcile cash and shares and show the error caused by omitting dividends. Changing a future suffix must not alter the completed ledger prefix.
17. Challenge Problems
44-C01: Look-Ahead and Model Boundaries
Prerequisite: the fourth moment of a normal distribution. For fixed
44-C02: Disconfirming the Claim That Higher Hedging Frequency Is Better
Compare error SD, lower-tail percentiles, and mean fees for 12/52/252 steps, with and without fees, using the frozen P-path results. Propose a real-quote test plan with separated training and evaluation periods and two conditions that would disconfirm “higher frequency is better.” Grading: 3 points for error/cost and units, 3 for a reproducible timeline/data-permission plan, and 4 for negative results and the boundary around post hoc exploration. This open-ended problem does not have one correct answer based only on which frequency has the highest mean.
18. Solutions / Solution Hints
44-E01
The terminal variances are N/N=1 for the first step size and N/N²=1/N for the second. The Brownian difference quotient has distribution N(0,1/h). For fixed M, the probability that it lies in [−M,M] tends to zero, ruling out convergence in probability to a finite random variable; proving nondifferentiability everywhere almost surely still requires control over all times. Independent squared increments give
44-E02
All three means are zero. Since ξ is known at
44-E03
The increments are [.2,−.1,.3], QV=.04+.01+.09=.14, the left-point sum is 0·.2+.2·(−.1)+.1·.3=.01, and the right-point sum is .2·.2+.1·(−.1)+.4·.3=.15. In general, the left sum is
44-E04
β=μ−q=.06 and the log-price drift is β−σ²/2=.04.
44-E05
λ=(.08−.05)/.2=.15,
44-E06
Subtracting the two state equations gives Δ=.5. In the down state, .5·80+1.05A=0, so A=−40/1.05; if B₀=1, the bond units are also A. The up-state value is 60−40=20 and the down-state value is 40−40=0, so the initial price is 50−40/1.05. The auxiliary probability is p=(1.05−.8)/(1.2−.8)=.625; its discounted expected payoff, (.625·20+.375·0)/1.05, equals the replication price. Changing the real-world up probability to .3 does not change the replicating payoff or cost; different state values or financing assumptions would require a new calculation.
44-E07
The self-financing gain equation is
44-E08
Under Q,
44-E09
Delta=
44-E10
Let
44-E11 (New Full Solution)
The four values of
44-E12 (New Full Solution)
The initial stock value is 60, cash is −50, and total value is 10. Selling .1 share brings in 10; stock value becomes 50, cash becomes −40, and total value remains 10. For a smooth semimartingale Delta,
44-P01 Reference Implementation
import numpy as np
from quant_course.stochastic_calculus import brownian_increments, ito_left, quadratic_variation
dw = brownian_increments(16, 1024, 1., 4402)
w = np.column_stack([np.zeros(16), np.cumsum(dw, axis=1)])
qv = quadratic_variation(w)
i = ito_left(w, w[:, :-1])
ordinary = .5 * w[:, -1] ** 2
print("ordinary minus Ito first path", ordinary[0] - i[0])
assert np.allclose(ordinary - i, .5 * qv)
assert np.max(abs(i - .5 * (w[:, -1] ** 2 - qv))) < 1e-12
print("finite/limit RMSE", np.sqrt(np.mean((i - .5 * (w[:, -1] ** 2 - 1)) ** 2)))
future = w.copy()
future[:, 513:] += 3
assert np.array_equal(ito_left(w[:, :513], w[:, :512]), ito_left(future[:, :513], future[:, :512]))
lookahead = np.repeat(w[:, -1, None], 1024, axis=1)
wrong = ito_left(w, lookahead)
assert np.allclose(wrong, w[:, -1] ** 2)
print("anticipating first path", wrong[0])
for invalid in [np.empty((0, 2)), np.array([[0., np.nan]])]:
    try:
        quadratic_variation(invalid)
    except ValueError:
        pass
    else:
        raise AssertionError("invalid input accepted")
The correct finite algebraic difference is affected only by rounding; the ordinary chain rule exceeds the left sum by QV/2. The theoretical mean of the anticipating sum is
44-P02 Reference Implementation
import math
import numpy as np
from quant_course.stochastic_calculus import brownian_increments, gbm_exact, gbm_euler
dw = brownian_increments(4096, 1024, 1., 4403)
for n in [16, 64, 256, 1024]:
    d = dw.reshape(4096, n, 1024 // n).sum(axis=2)
    ex = gbm_exact(100., .06, .2, 1/n, d)
    eu = gbm_euler(100., .06, .2, 1/n, d)
    error = eu[:, -1] - ex[:, -1]
    rmse = np.sqrt(np.mean(error**2))
    mean = error.mean()
    se = error.std(ddof=1) / np.sqrt(4096)
    population = 100 * ((1 + .06/n)**n - math.exp(.06))
    print(n, rmse, mean, se, population)
If independent noise is drawn for the two methods, the difference still estimates the difference between their means without bias, but its SE is larger; its pathwise RMSE is no longer the strong discretization error measured with common noise. This exercise requires aggregation of shared fine increments and retains the nonmonotone weak sample result; the four means need not be strictly monotone.
44-P03 Reference Implementation
import numpy as np
from quant_course.derivatives_pricing import bs_price, crr_price, mc_price
p = dict(S=100., K=100., T=1., r=.05, q=.02, sigma=.2)
c, put = bs_price(**p), bs_price(**p, kind="put")
assert abs(c - put - 100*np.exp(-.02) + 100*np.exp(-.05)) < 1e-10
print("BS", c, put)
for n in [10, 25, 50, 51, 100, 101, 200, 400]:
    print(n, crr_price(**p, steps=n) - c)
z = np.random.default_rng(4401).standard_normal(50000)
correct = np.exp(-.05) * np.maximum(100*np.exp(.01+.2*z)-100, 0)
wrong = np.exp(-.05) * np.maximum(100*np.exp(.04+.2*z)-100, 0)
print("wrong drift minus Q plain estimate", wrong.mean() - correct.mean())
assert bs_price(**dict(p, T=0)) == 0
assert bs_price(**dict(p, r=-.01)) >= 0
assert mc_price(**dict(p, sigma=0))["se"] == 0
try:
    crr_price(**dict(p, r=1., sigma=.01), steps=1)
except ValueError:
    pass
else:
    raise AssertionError("invalid probability clipped")
44-P04 Reference Implementation
import numpy as np
from quant_course.derivatives_pricing import bs_price, bs_greeks, mc_price
p = dict(S=100., K=100., T=1., r=.05, q=.02, sigma=.2)
for spot in [80., 100., 120.]:
    for kind in ["call", "put"]:
        a = dict(p, S=spot)
        g = bs_greeks(**a, kind=kind)
        h, hs = .0001, .01
        def v(key, bump):
            inputs = dict(a)
            inputs[key] += bump
            return bs_price(**inputs, kind=kind)
        fd = {
            "delta": (v("S", hs)-v("S", -hs))/(2*hs),
            "gamma": (v("S", hs)-2*bs_price(**a, kind=kind)+v("S", -hs))/hs**2,
            "vega": (v("sigma", h)-v("sigma", -h))/(2*h),
            "theta": -(v("T", h)-v("T", -h))/(2*h),
            "rho": (v("r", h)-v("r", -h))/(2*h),
        }
        for key in g:
            assert abs(fd[key]-g[key]) < 2e-5
        print(spot, kind, "Vega per 1pp", .01*g["vega"])
for h in [.01, .0001, .000001, .00000001]:
    hs = 100*h
    gamma = (bs_price(**dict(p, S=100+hs))-2*bs_price(**p)+bs_price(**dict(p, S=100-hs)))/hs**2
    print("h/Gamma error", h, gamma-bs_greeks(**p)["gamma"])
z = np.random.default_rng(4401).standard_normal(1000)
y = np.exp(-.05)*np.maximum(100*np.exp(.01+.2*z)-100, 0)
ya = np.exp(-.05)*np.maximum(100*np.exp(.01-.2*z)-100, 0)
x = (y+ya)/2
se = x.std(ddof=1)/np.sqrt(1000)
assert np.isclose(se, mc_price(**p, pairs=1000)["se"])
print("paired SE / wrong flat SE", se, np.r_[y, ya].std(ddof=1)/np.sqrt(2000))
for a in [dict(p, T=0), dict(p, sigma=0)]:
    try:
        bs_greeks(**a)
    except ValueError:
        pass
    else:
        raise AssertionError("unsupported boundary Greek accepted")
try:
    mc_price(**p, pairs=1)
except ValueError:
    pass
else:
    raise AssertionError("one random observation reported SE zero")
The reference implementation checks each of the five Greeks and gives the Vega conversion, Gamma step-size diagnostic, and correlated-sample Monte Carlo diagnostic. The core tests and CLI use the same unit contract.
44-P05 Reference Implementation
import math
import numpy as np
from quant_course.derivatives_pricing import bs_price, bs_greeks, delta_hedge
path = np.array([100., 110., 105., 90.])
r, q, sigma, fee, dt = .05, .02, .2, .001, 1/3
result = delta_hedge(path, 1., r, q, sigma, 100., cost_rate=fee)
cash = bs_price(100., 100., 1., r, q, sigma)
shares, total, cash_no_dividend = 0., 0., cash
for i, row in enumerate(result["ledger"]):
    if i:
        cash = cash*math.exp(r*dt) + shares*path[i-1]*math.expm1(q*dt)
        cash_no_dividend *= math.exp(r*dt)
    target = 0. if i == 3 else bs_greeks(path[i], 100., 1-i*dt, r, q, sigma)["delta"]
    change = target-shares
    cost = fee*abs(change)*path[i]
    cash -= change*path[i]+cost
    cash_no_dividend -= change*path[i]+cost
    shares = target
    total += cost
    assert abs(cash-row["cash"]) < 1e-10
    assert abs(shares-row["delta"]) < 1e-12
    assert abs(cash+shares*path[i]-row["portfolio_value"]) < 1e-10
assert abs(total-result["total_cost"]) < 1e-12
assert abs(cash-max(path[-1]-100, 0)-result["error"]) < 1e-10
print("missing dividend cash error", cash_no_dividend-cash)
changed = path.copy()
changed[-1] = 150.
prefix = delta_hedge(changed, 1., r, q, sigma, 100., cost_rate=fee)["ledger"]
assert prefix[:-1] == result["ledger"][:-1]
Dividends are approximated using the old share count and the left-endpoint stock price over each interval; financing is applied to old cash before rebalancing at the current price. The final target is 0, so liquidation incurs a fee. The incorrect cash_no_dividend ledger follows the same specified share positions but omits dividends, producing a cash difference; comparing only total stock return would miss it.
44-C01 Reference Argument
The discrete sum is
44-C02 Reference Argument and Rubric
Read the frozen results in §8 and report error SD, the 5th percentile, and cash fees on the same 256 paths. Higher frequency may reduce frictionless error inside the model, but the fee-inclusive tail and mean need to be compared; simultaneous improvement is not guaranteed. Estimate volatility, fees, and dividends on a training period, then compare only in a later evaluation period under fixed quote, timing, and execution conventions. Give the data URL, permissions, version/hash, timezone, and next eligible execution time. If fees at higher frequency enlarge the replication-shortfall tail, or if every frequency breaches the risk limit under jumps, that disconfirms “higher frequency is always better.” It is also possible that quotes cannot be synchronized and the result remains unresolved. Mark parameter changes as post hoc and retain negative results. The chapter's simulation does not substitute for completion of a real project.
19. Further Reading
Must Know: Review Taylor expansions and centered differences from Chapter 4, conditional expectation from Chapter 6, and payoffs and total returns from Chapters 10/11. For this chapter, focus on one-period replication, the second-order Itô term, self-financing with q, P/Q, and paired Monte Carlo SE.
Should Know: MIT 15.070J Lectures 15–17 on Itô integrals/formula and Lecture 19 on self-financing help check the left-point convention and square-integrability assumptions. Read the Black–Scholes (1973) no-dividend model assumption and Merton (1973) §7 dividend extension at the cited locations.
Advanced: CMU Risk Neutral Measures on Girsanov/Novikov and risk-neutral pricing. Measure theory, martingale representation, general Feynman–Kac conditions, and American-option free boundaries require additional prerequisites; this chapter does not provide complete proofs of those general theorems.
Optional: Hull, Options, Futures, and Other Derivatives, and Shreve, Stochastic Calculus for Finance I/II, are useful for a full course. The exact edition's copyright page was not checked, so no page numbers are invented. Before studying local/stochastic volatility and jumps, be able to independently reconcile the cash ledger in this chapter.
20. References
The key sources and the locations actually read for this chapter are listed in source_notes.md; the global source ledger is in references/sources.json. The original papers support theoretical claims. The inputs, outputs, code hashes, and run records for the chapter's simulations are a separate layer of evidence.
- CH44_BS1973: Black & Scholes, 1973, original paper hosted by Princeton courses, JPE 81(3), 637–654, DOI 10.1086/260062. Supports the no-dividend original model assumption and dynamic replication.
- CH44_MERTON1973: Merton, 1973, original paper hosted by Boston University, Bell J. Econ. Manag. Sci. 4(1), 141–183, DOI 10.2307/3003143, §7 equations 42–44 and footnote 62 support the dividend-inclusive PDE and European call.
- CH44_MIT_ITO: MIT 15.070J Fall 2013 lecture notes, Lectures 14–17 and 19; exact ranges are in the reading ledger.
- CH44_CMU_RNM: CMU Risk Neutral Measures, Chapter 4, Theorem 1.6 and Remark 1.9 support the density sign and Novikov condition.
- CH44_NUMPY_NORMAL: NumPy Generator.normal, supports the loc/scale/shape interface.
- CH44_HIGHAM2001: Desmond J. Higham (2001), original paper hosted by a university, SIAM Review 43(3), 525–546, DOI 10.1137/S0036144500378302; §§4–5 describe Euler, shared Brownian increments, and strong/weak error definitions. The original strong-error experiment uses L1; this chapter's RMSE is separately derived analytically.
- CH44_SCIPY_NORM: SciPy norm, supports the numerical standard-normal CDF/PDF interface.