CHAPTER 40/ 45
: Tree-Based Models
Author: Yuxiao Ma. The existing A8-B constructed implementation has been accepted within a limited scope and is pending formal integration; this does not mean that real research is complete. Core idea: trees approximate nonlinearities and interactions with piecewise-constant predictions; random forests reduce variance by averaging; gradient boosting iteratively repairs residuals along the negative gradient. Their depth, leaf size, number of rounds, and learning rate must all be selected using date-based validation inside the training data. Feature importance is a bounded diagnostic; economic conclusions still depend on a portfolio compared with benchmarks under the same accounting and costs. Prerequisites: the Chapter 38 pipeline (date-based walk-forward validation, label-availability times, and in-training tuning) and Chapter 39 regularized linear models (bias–variance and benchmark comparison). After completing this chapter, you should be able to hand-calculate an optimal split and two rounds of boosting; derive the random-forest variance formula; explain why built-in early stopping in sklearn 1.9.1 HistGradientBoosting cannot be used directly for a panel; compare tree and linear models on predictive metrics and after-cost results within the Chapter 38 pipeline; compute date-wise permutation importance and explain its limits with correlated features.
1. Chapter Objectives
- Write down the split objective for a regression tree, derive “split gain
,” and hand-calculate a split for eight stocks. - Explain how depth and leaf sample size (
min_samples_leaf) constrain tree variance, and identify which splits are infeasible under a given constraint. - Derive the variance of an average of
trees with pairwise correlation , , and explain why random forests sample features at random. - Derive why each round of gradient boosting fits residuals under squared loss and how the learning rate shrinks each step; hand-calculate two rounds of boosting; explain how the HistGradientBoosting leaf value
relates to Ridge shrinkage in Chapter 39. - Select depth, leaf size, and number of rounds (early stopping) by date within the training data, and explain why sklearn's built-in random holdout for early stopping leaks information in panels.
- Compute date-wise permutation importance, compare it with mean decrease in impurity (MDI), and explain how correlated features, the sample period, and multiple comparisons affect it; explain SHAP's additivity and limitations.
- Compare out-of-sample and after-cost performance for zero prediction, the training mean, OLS, Ridge, a single tree, a random forest, and gradient boosting on an interaction panel and the Chapter 39 linear panel; use the Project 6 v2 protocol for ablation and stability reporting.
Completion criteria: You can independently complete Sections 15–17; code/ch40_tree_models.py reproduces the numbers in Sections 8–10.
2. Why Quant Needs Tree Models
Linear models assume that each feature has a fixed slope with respect to expected returns. Two common departures in cross-sectional research are effects that vary with another feature (interactions—for example, a price-volume signal that works only for illiquid stocks) and non-monotone effects (both tails are unusual, while the middle is ordinary). Linear models require the researcher to add interaction and piecewise terms by hand, and the number of candidate combinations grows quickly with the number of features.
Tree models automatically search for “which feature and threshold should split the sample.” Gu, Kelly, and Xiu (2020) report higher out-of-sample
3. Intuition
There are eight stocks. Feature
| Stock | 1 | 2 | 3 | 4 | 5 | 6 | 7 | 8 |
|---|---|---|---|---|---|---|---|---|
| 1 | 2 | 3 | 4 | 5 | 6 | 7 | 8 | |
| −2 | −1 | −1 | 0 | 2 | 1 | 3 | 2 |
A depth-1 tree (a stump) asks one question: “Is
The boundary of this example: it has one feature and no independent validation set from later dates. A tree can keep splitting until each leaf contains one stock, reducing training error to 0. That zero training error reveals the risk of overfitting, but these eight rows cannot prove that the next week must be worse; evaluation requires validation or test data from later dates. Depth and leaf-size constraints, random-forest averaging, and the learning rate and number of boosting rounds all address the problem of splitting too finely.
4. Mathematical Setup
| Symbol | Meaning | Dimension / unit |
|---|---|---|
| Number of sample rows in a node (or training set) | — | |
| Feature vector for row |
Original feature units (trees do not require standardization) | |
Label: simple return from trade_time to label_end |
Decimal; hand calculations use % | |
| Feature-space region corresponding to leaf |
— | |
| Prediction in leaf |
Same unit as |
|
| Sum of squared errors in node |
Squared units of |
|
| Number of trees in the forest | — | |
| Prediction variance of one tree at a fixed |
Units of |
|
| Prediction after boosting round |
Same unit as |
|
Learning rate (sklearn learning_rate) |
— | |
Number of boosting rounds (HGB max_iter) |
— | |
| Squared loss | Units of |
Prerequisites: Chapter 8 least squares (the mean minimizes squared error), Chapter 9 gradient descent, Chapter 39 bias–variance decomposition and the Ridge shrinkage factor signal_time is the close of trade_time is the close of label_end label_available_at
5. Formal Definitions
Regression tree (CART). Recursive axis-aligned splits partition feature space into disjoint rectangular regions
At each split, choose feature squared_error criterion in sklearn 1.9.1 DecisionTreeRegressor chooses
Depth and leaf samples. max_depth limits the number of splits from root to leaf, allowing at most min_samples_leaf requires each leaf to contain at least the specified number of training rows; a split that violates this condition is infeasible. Both constraints limit model complexity and therefore variance. In a panel, a row is one stock on one day, and rows from the same day are highly correlated. “1,000 rows” is far from 1,000 independent observations (see the effective sample discussion in Chapter 37), so leaf sizes generally need to be much larger than in nonfinancial applications.
Bagging and random forests. Bagging draws max_features, reducing dependence across trees. In sklearn 1.9.1, RandomForestRegressor defaults to max_features=1.0 (no feature subsampling, equivalent to bagging); max_samples controls how many rows each tree draws.
Gradient boosting. Starting from a constant
This extends Chapter 9 gradient descent from parameter space to “prediction-function” space: a tree approximates the direction of each step. sklearn 1.9.1 HistGradientBoostingRegressor (HGB) first bins each feature into at most 255 bins using training data, then searches for splits using sums of gradients and second derivatives within bins.
Learning rate and early stopping. The learning rate
Mean decrease in impurity (MDI). For each feature, sum the weighted SSE reductions from all splits that use the feature, then normalize. sklearn's documentation refers to this as “Gini importance” and warns that it is biased toward features with many possible split values. It is computed on training data.
Permutation importance. On a validation set that was not used for fitting, shuffle a feature's values and measure the increase in loss:
where signal_time (cross-sectionally), never across dates, so date-level market conditions are preserved; the decline in daily Spearman IC is also reported. Group permutation applies the same row permutation to all columns in a group, preserving their joint distribution.
SHAP (Shapley additive explanations). Given a prediction
where
Ablation. A pre-registered comparison run that removes a feature group or swaps out a component, using the same folds, portfolio construction, and costs, to answer: “How much does this component contribute to out-of-sample results?”
6. Derivations
6.1 Leaf Values and Split Gain
The leaf value is the mean. A constant leaf prediction
Within-group and between-group decomposition. Split parent node
Simplifying the between-group term. Since
Two implications follow. First, gain grows with the squared difference between the two means, but split comparisons must also include the sample-balance factor min_samples_leaf is meant to guard against. For the Section 3 example at
Decision use. The formula shows what a tree looks at: the product of the squared difference in group mean returns and the sample-balance weight. It does not look at slope or rank correlation. A feature useful for ranking but with a small difference in group means may never be selected.
6.2 Averaging Reduces Variance:
Fix a feature point
The first step expands the variance of the sum into max_features is not guaranteed to be better. The formula matches Equation (15.1) in the second edition of ESL (see Section 20 for review status).
Financial interpretation: every tree sees the same chance market episode within a training window, so averaging cannot remove it. A longer sample, coarser leaves, or validation on a different window is needed to expose that error.
6.3 Gradient Boosting Fits Residuals Round by Round under Squared Loss
Initialization.
Negative gradient. For
Fit and update. Fit a shallow tree
Learning-rate shrinkage. Suppose each round selects the same partition. Let the initial mean residual in leaf
HGB leaf value. sklearn 1.9.1 HGB computes a leaf value using the gradient sum compute_node_value in splitting.pyx and shrinkage in grower.py; see D06 and Section 20). Under squared loss
l2_regularization
6.4 Early Stopping Must Hold Out by Date
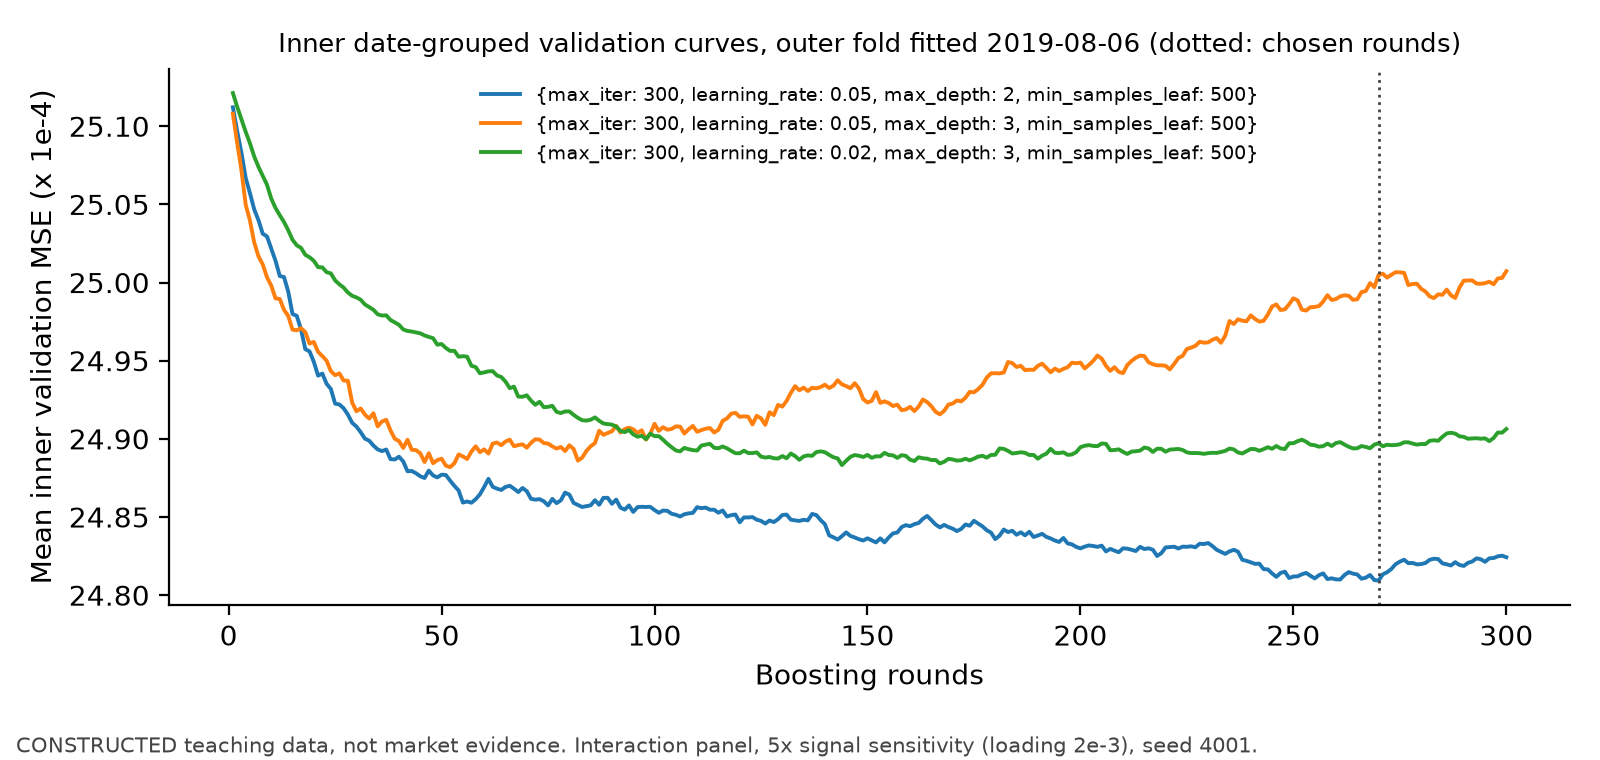
When the training set has more than 10,000 rows, HGB's early_stopping="auto" turns early stopping on and uses train_test_split (test_size=validation_fraction) to randomly sample 10% of training rows as a validation set (local source lines 533–581). This creates two problems in panels: other stocks from the same day remain in the training set, so validation rows share that day's market shock with training rows; and five-day label intervals overlap, with adjacent signal dates sharing four days of returns, so the validation labels have almost been “seen” on the training side. Random row holdout breaks the time-out-of-sample validation design and may understate error. In the constructed panel in Section 12.1, it indeed stops too late, but this is not a theorem that it always selects more rounds or always worsens test results. The correct approach is to disable built-in early stopping, treat the number of rounds as a hyperparameter, record validation MSE at every round (staged_predict) on the inner date-based walk-forward folds in Chapter 38, choose the minimum of the mean curve, and refit on all outer-training rows using that number of rounds. Evaluate the outer test window only once. Section 12.1 compares the numbers from random early stopping and date-based early stopping.
6.5 Permutation Importance with Correlated Features
Let
The second issue is extrapolation. If
Third, importance depends on the sample period: the result belongs to the window and fold used to compute it. In this book, importance used for any selection is computed only on in-training validation windows; importance computed on an outer test window is a post hoc diagnostic and must not feed back into that window or any later model, parameter, or feature selection.
6.6 Shapley-Value Additivity and Limitations
Take
Adding gives
7. Financial Interpretation
What trees capture. A tree predicts different mean returns on either side of a split and is well suited to conditional effects: a signal may work only for a particular class of stocks. For example, in the interaction panel in Section 8,
Effects of piecewise-constant predictions on portfolios. All stocks in a leaf receive the same prediction, creating many tied cross-sectional ranks. With shallow trees and large leaves, a dollar-neutral portfolio is effectively long and short across a few “buckets”; Spearman IC is less informative when there are many ties. Forests and boosting add many trees and reduce ties, but their predictions remain step functions.
Extrapolation. A feature value outside the training range falls into an outermost leaf, where the prediction remains constant; it does not extrapolate along a slope as a linear model would. In extreme markets, this can protect against amplified predictions while also hiding effects in a new region.
Turnover and costs. Tree predictions jump at thresholds: a small feature change across a split can move a prediction and portfolio weight by a full step. This can increase turnover; a small accuracy advantage may be erased by costs. Section 13 compares after-cost results using the same Chapter 29 accounting.
Implementability and timing. A strictly monotone transformation preserves training-point order and separable training partitions (ignoring floating-point effects, ties, and binning boundaries), but it does not guarantee identical predictions for new points after a nonlinear transformation. For training data signal_time is ready; fit transformations and bins across time using training rows only.
8. Numerical Example
All numbers in this section are constructed for teaching. Sections 8.1–8.4 are hand calculations, checked against scikit-learn 1.9.1 by the hand-calculation portion of code/ch40_tree_models.py; Section 8.5 comes from the registered main simulations in the same script (seed and settings in its docstring and D08 of qa/a8/ch40_ch41_batch/DECISION_LOG.md). Section 8.6 is the D11 fivefold sensitivity added after seeing the main results, not a primary result specified in advance.
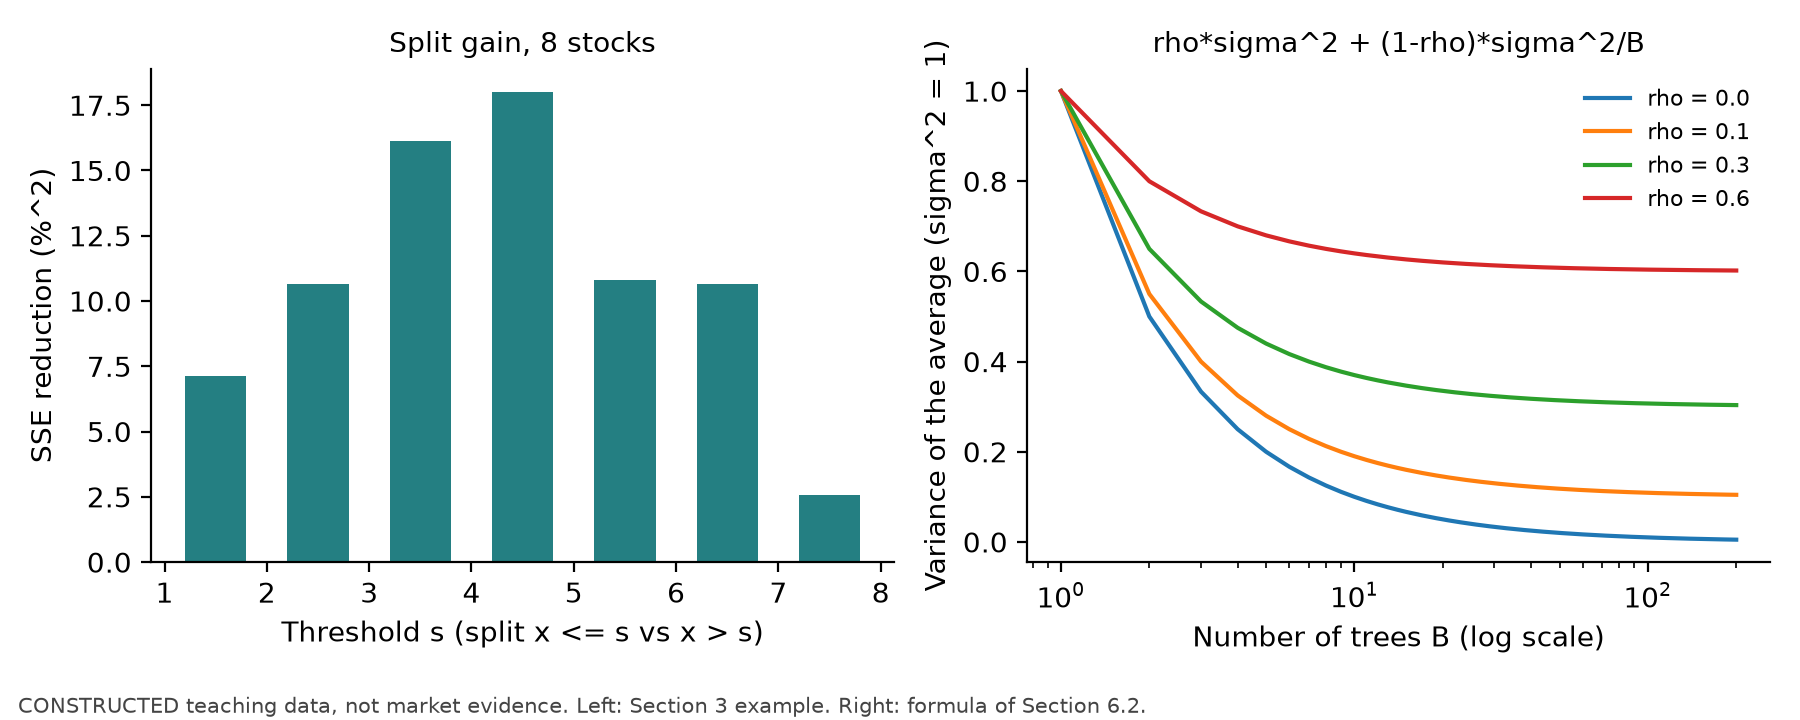
8.1 One Split: Calculate Each Threshold
Use the eight stocks from Section 3 (the unit of
| Threshold |
Gain |
Closed-form value | |||||
|---|---|---|---|---|---|---|---|
| 1.5 | 1 | −2.000 | 0.857 | 0.000 | 14.857 | 7.143 | 7.143 |
| 2.5 | 2 | −1.500 | 1.167 | 0.500 | 10.833 | 10.667 | 10.667 |
| 3.5 | 3 | −1.333 | 1.600 | 0.667 | 5.200 | 16.133 | 16.133 |
| 4.5 | 4 | −1.000 | 2.000 | 2.000 | 2.000 | 18.000 | 18.000 |
| 5.5 | 5 | −0.400 | 2.000 | 9.200 | 2.000 | 10.800 | 10.800 |
| 6.5 | 6 | −0.167 | 2.500 | 10.833 | 0.500 | 10.667 | 10.667 |
| 7.5 | 7 | 0.286 | 2.000 | 19.429 | 0.000 | 2.571 | 2.571 |
The closed-form column uses DecisionTreeRegressor(max_depth=1) returns the same threshold, 4.5, and leaf values min_samples_leaf=3, only
8.2 Random-Forest Variance
Let
8.3 Two Boosting Rounds with Learning Rate 0.5
Round 0:
Round 1: Find the best stump for the residuals. Because the residuals are
Round 2: The new residuals are
The setup below produces exactly the same
HistGradientBoostingRegressor(max_iter=2, learning_rate=0.5, max_leaf_nodes=2,
                              min_samples_leaf=1, early_stopping=False)
Leaf-value shrinkage. On the same data, with max_iter=1, learning_rate=1, max_depth=1, and l2_regularization=4, the residual sum in the left leaf is
8.4 Small Examples of Permutation Importance and Shapley Values
Twin features. There are four stocks on one day, with
- Permute
only: predictions become , MSE is 1.575, and importance is 1.560. - Permute
only: predictions do not change, so importance is 0. - Permute both columns together: importance is 1.560.
Shapley values for an interaction. Let
8.5 Run Results: Interaction and Linear Panels (Main Results)
Setup (registered before the run). There are 40 assets and 1,260 trading days. The conditional mean for the interaction panel is
| Panel | Model | Mean IC | After-cost Sharpe 10 bp | 20 bp | Annual turnover | |
|---|---|---|---|---|---|---|
| Interaction | OLS | −0.803% | −0.0072 | −1.15 | −1.53 | 24.5 |
| Interaction | Ridge | −0.075% | −0.0098 | −1.25 | −1.63 | 24.4 |
| Interaction | Single tree | −0.342% | 0.0019 | −0.10 | −0.56 | 31.6 |
| Interaction | Random forest | −0.116% | −0.0030 | −0.93 | −1.43 | 30.8 |
| Interaction | Gradient boosting | −0.010% | 0.0069 | −0.63 | −1.17 | 36.7 |
| Linear | OLS | −0.614% | 0.0122 | −0.06 | −0.44 | 24.1 |
| Linear | Ridge | −0.146% | 0.0128 | 0.04 | −0.35 | 23.8 |
| Linear | Single tree | −0.343% | 0.0057 | 0.59 | 0.14 | 28.1 |
| Linear | Random forest | −0.018% | 0.0120 | 0.22 | −0.29 | 30.2 |
| Linear | Gradient boosting | −0.040% | −0.0003 | −0.50 | −1.06 | 35.8 |
Zero prediction and the training-mean portfolio are both flat. Every model has negative
8.6 Signal-Strength Sensitivity (Added Post Hoc, D11)
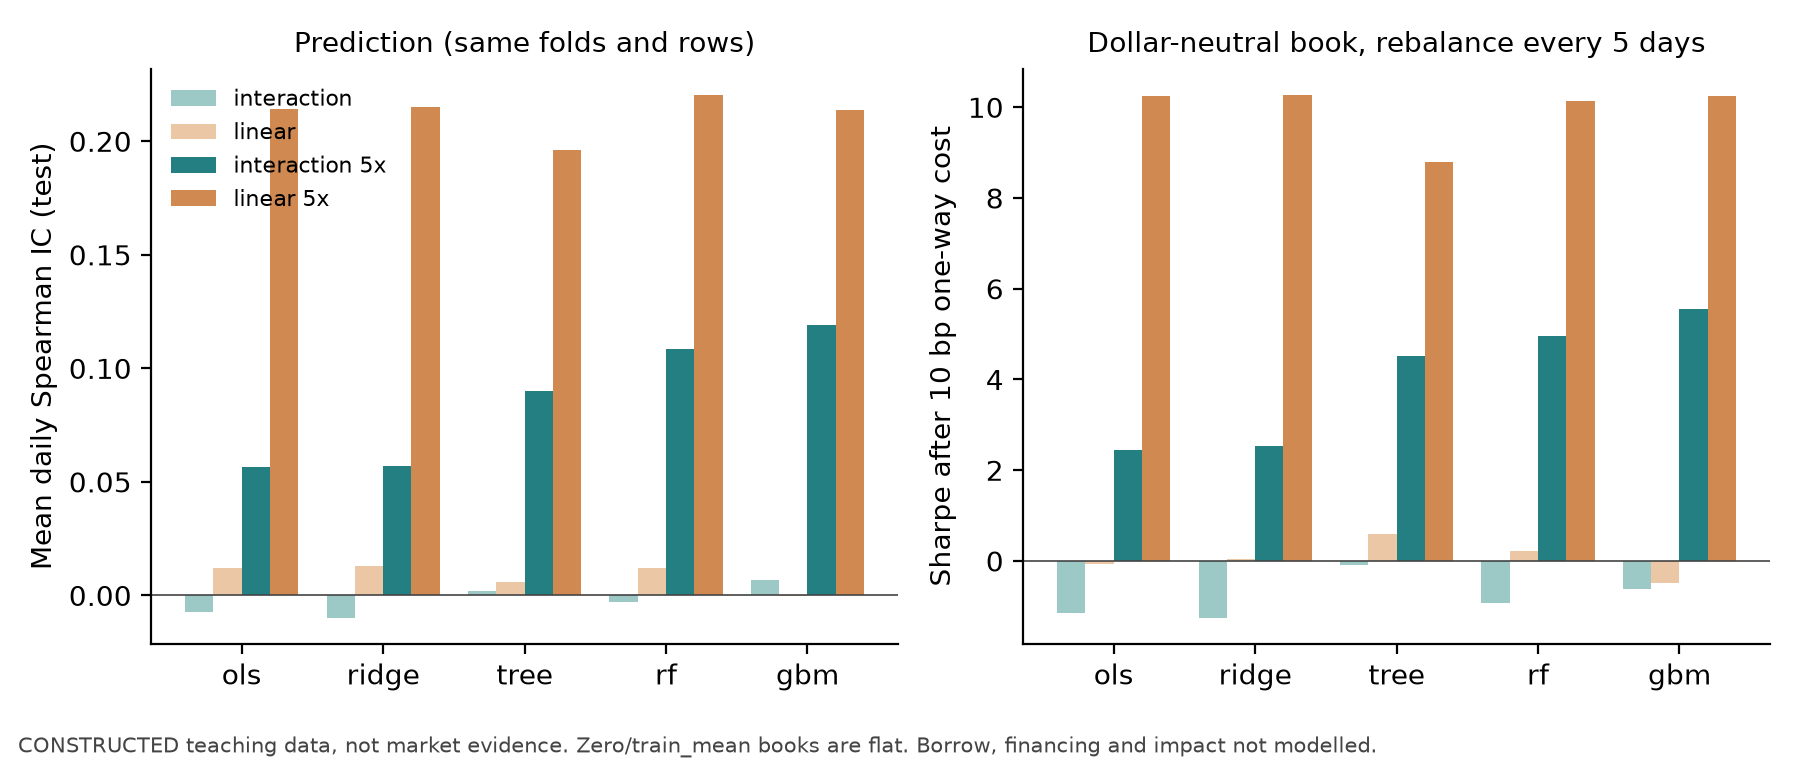
After viewing the main results, both panels' loadings were increased fivefold to 0.002 to show what trees can do when a signal is detectable; all other settings were unchanged. This was not a registered main result. Sharpes of 5–10 are far beyond any realistic strategy and indicate only an excessively strong constructed signal.
| Panel (5×) | Model | Mean IC (NW |
After-cost Sharpe 10 bp | Annual turnover | |
|---|---|---|---|---|---|
| Interaction | OLS | −0.069% | 0.057 (5.5) | 2.45 | 23.5 |
| Interaction | Ridge | 0.196% | 0.057 (5.5) | 2.54 | 23.9 |
| Interaction | Single tree | 1.012% | 0.090 (10.0) | 4.51 | 33.4 |
| Interaction | Random forest | 0.970% | 0.108 (11.2) | 4.95 | 27.8 |
| Interaction | Gradient boosting | 1.162% | 0.119 (13.0) | 5.55 | 34.9 |
| Linear | OLS | 4.146% | 0.214 (21.6) | 10.24 | 22.6 |
| Linear | Ridge | 4.201% | 0.215 (21.5) | 10.27 | 22.2 |
| Linear | Single tree | 3.101% | 0.196 (19.9) | 8.79 | 28.1 |
| Linear | Random forest | 3.812% | 0.221 (22.3) | 10.15 | 22.6 |
| Linear | Gradient boosting | 4.043% | 0.214 (22.0) | 10.25 | 25.0 |
On the interaction panel, tree models achieve about twice the IC of linear models: linear models can use only the average slope on
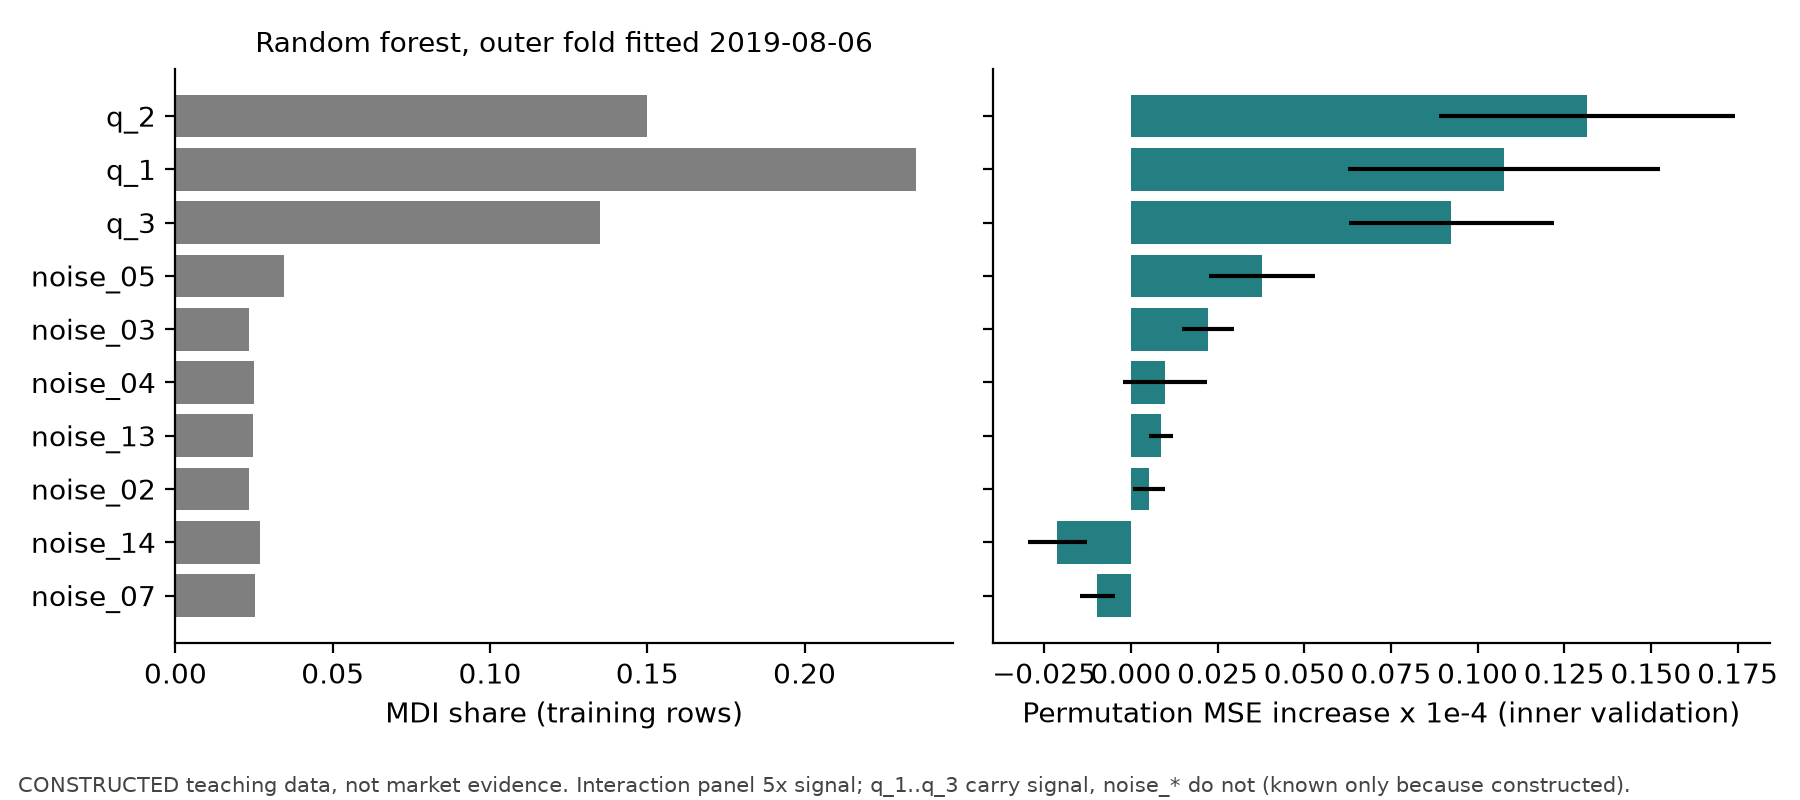
Importance. On the fivefold interaction panel, the random forest computes date-wise permutation importance on the last inner validation window of each fold (three repeats). Mean MSE increases for noise_05 also enters the top 10 in 7 folds, with a mean increase of noise_05, noise_04, noise_18), and adjacent-fold ranking correlation averages only 0.12. In the last fold, MDI ranks noise_05 the largest at
9. Python Implementation
- Core module:
src/quant_course/tree_models.py(contract in Section 1 ofqa/a8/ch40_ch41_batch/INTERFACE_CONTRACT.md):make_estimator,fit_select_predict_tree,walk_forward_predict_tree,permutation_importance_by_date, andsimulate_interaction_panel. The outer and inner folds, label-availability times, and missing-value rules reuse Chapter 38'sml_pipeline.date_walk_forward; evaluation and portfolio accounting reuseprediction_metricsandbacktest_predictions(Chapter 29run_backtest). Tests:tests/test_tree_models.py. - Chapter script. To reproduce, pass only
--out. The--figures-diroption overwrites source images in this chapter's figures/ directory; use it only when intentionally refreshing source images:
.venv/bin/python code/ch40_tree_models.py --out <new-directory>
On this machine, the four panels, seven models, importance calculations, and demonstration take 4–13 minutes (the random forest uses n_jobs=-1 and runs more slowly alongside other tasks). Outputs are results.json and four figures; the script refuses to use an existing output directory.
- Seed: 4001 for the panels and models; permutation importance also uses 4001. With
early_stopping=False, HGB is deterministic for a given dataset. - Timing: daily frequency;
signal_timeis the close of; trade_timeis the close of; the return interval is from the close of to the close of ; label_available_atis. - Missing values: drop and count training rows with any missing feature or label; do not predict a test row with any missing feature (the stock remains flat for that period); raise an error for infinite values. The first 60 days are excluded from training because mom_60_5 is missing.
Minimal example (one fold, random forest, in-training tuning and importance):
from quant_course import ml_pipeline as mp, tree_models as tm
close, chars = tm.simulate_interaction_panel(n_assets=12, n_days=420, n_noise=4,
                                             signal_loading=2e-3, seed=1)
labels = mp.make_forward_labels(close, horizon=5, execution_lag=1)
X = mp.stack_features(chars, labels.index)
folds = mp.date_walk_forward(labels.index.get_level_values(0), labels["label_start"],
                             labels["label_end"], labels["label_available_at"],
                             min_train_dates=250, test_dates=63)
grid = [{"n_estimators": 50, "min_samples_leaf": 50, "max_features": 0.5}]
res = tm.fit_select_predict_tree(X, labels, folds[0], model="rf", seed=1, param_grid=grid,
                                 importance_repeats=2, inner_val_dates=42,
                                 inner_min_train_dates=126)
imp = res.inner_importance["d_mse_mean"].round(8).to_dict()
print(res.chosen_params, res.n_train_used, imp)
10. Visualization
All four figures are generated by code/ch40_tree_models.py and stored in course/zh/chapters/ch40/figures/: Figure 1 (Sections 8.1–8.2); Figure 2 (Section 8.6, inner validation curves and selected number of rounds); Figure 3 (Sections 8.5–8.6, IC and after-cost Sharpe across four panels); Figure 4 (Section 8.6, MDI and permutation importance). Each caption identifies the axes, units, sample, and key observation; each figure is marked as constructed data.
11. Real-Market Example
Status: experiment pending. This course does not have an authorized daily individual-stock panel (projects/project06/data_manifest.json; real_data.status = blocked), so this chapter reports no real-market results.
Literature comparison (not evidence from this book): Gu, Kelly, and Xiu (2020) use monthly U.S. individual-stock data from 1957–2016 with 920 features (sample description starting on p. 2248), an initial training set of 1957–1974, validation set of 1975–1986, and test set of 1987–2016. They refit annually, expanding the training set by one year and rolling the 12-year validation set forward; they do not use cross-validation, to preserve time order (p. 2249 and footnote 32). Out-of-sample monthly
What would be needed for follow-up: an authorized daily individual-stock panel (unadjusted prices, volume, splits and dividends, delisted stocks, and dated index constituents), covering at least eight years. Required fields and authorization are specified in data_manifest.json. Once the data are available, rerun from the data node under the Project 6 v2 protocol.
12. Common Mistakes
12.1 Using sklearn's Built-In Early Stopping on a Panel
Mistake: Set early_stopping=True and validation_fraction=0.1 in HistGradientBoostingRegressor (the default "auto" also turns it on for more than 10,000 rows). Why: built-in early stopping randomly samples 10% of the training rows for validation; other stocks from the same day and overlapping labels remain on the training side (Section 6.4). Difference on the main interaction-panel result in Section 8.5, across 12 outer folds, with learning rate 0.05, depth 3, minimum leaf size 500, at most 1,000 rounds, and stopping after 20 rounds without improvement:
| Mean rounds | Mean validation MSE ( |
Mean test MSE ( |
|
|---|---|---|---|
| Built-in random-holdout early stopping | 1,000 (all 12 folds ran to the limit) | 22.06 (random holdout rows) | 26.01 |
| Inner date-based validation for round selection (book method) | 1–104, median 8 | — | 24.72 |
| Zero prediction | — | — | 24.76 |
The random-holdout validation error kept falling, so early stopping never triggered. Test error was higher in all 12 folds than under date-based selection and also higher than for zero prediction. The random-holdout MSE of 22.06 is about 15% below test error, a direct measure of its optimism. Fix: set early_stopping=False and select the number of rounds with staged_predict on inner date-based folds (the tree_models factory rejects early-stopping-related parameters for gbm).
import numpy as np
from sklearn.ensemble import HistGradientBoostingRegressor
X = np.random.default_rng(0).normal(size=(12_000, 5))
y = X[:, 0] * 0.1 + np.random.default_rng(1).normal(size=12_000)
auto = HistGradientBoostingRegressor(max_iter=50, random_state=0).fit(X, y)  # "auto"
print(auto.do_early_stopping_, auto.validation_fraction)  # True 0.1: random 10% holdout
Output: True 0.1.
12.2 Selecting the Number of Rounds on the Test Window
Mistake: Inspect MSE round by round on the outer test window and report the best round. On the same panel with fixed parameters and 300 rounds per fold, selecting the best round on the test window gives
12.3 Assuming Trees Need No Preprocessing, So Full-Sample Preprocessing Is Fine
Mistake: Winsorize by full-sample quantiles, or fit bins or standardization on the full sample, before passing data to a tree. Why: a strictly monotone transformation preserves training order but does not guarantee new-point predictions under the nonlinear midpoint rule (counterexample in Section 7); winsorization and binning are not one-to-one strictly monotone transformations either. If thresholds or bin edges are set by the full-sample distribution, test-period extremes can change training-period values and therefore the splits. Fix: fit transformations across time only on training rows; compute a cross-sectional rank for a signal_time only once all required cross-sectional information is available. HGB's binning happens inside fit using only the rows passed to it, which satisfies this requirement.
12.4 Selecting Features with MDI or Test-Period Importance
Mistake: Keep the top feature_importances_ or from permutation importance on the outer test window, then report out-of-sample results. Why: MDI is computed on training rows and favors continuous features with many possible split points (in Section 8.6, noise columns receive about half the total MDI share); test-period importance uses test labels. Fix: select features only using permutation importance on in-training validation windows (select_top_k; the Project 6 v2 top-10 ablation). Test-period importance is only a post hoc diagnostic.
12.5 Reading an Importance Ranking as an Economic Mechanism
Mistake: Report that “noise_05 is the fourth most important feature.” Why: when the signal is weak, permutation importance can assign positive values to noise columns that happen to correlate with returns in a validation window; correlated features can substitute for one another (the twin-feature example in Section 8.4); rankings vary across folds (adjacent-fold correlation is 0.12 in the main result). Fix: report stability across folds (whether each feature enters the top 10) and group importance, treating importance as a diagnostic rather than a discovery.
13. Quantitative Research Application
Question. On the constructed panel frozen for Project 6, do tree models improve out-of-sample prediction and after-cost portfolios relative to zero prediction, the training mean, and regularized linear models? Are results stable, and which feature groups contribute?
Protocol (projects/project06/configs/p06_trees_v2.json, frozen before the first v2 run, SHA-256 60101509…). It inherits the v1 data generator, two registered scenarios (baseline and loading sign reversal at 75% of the sample), features (3 price features + 3 loaded features + 40 zero-loading features), max_features=0.33, leaf sizes 500/2,000, max_samples=0.5); gradient boosting (HGB, up to 300 rounds, learning rates 0.05/0.02, depths 2/3, minimum leaf size 500, with round selection on inner date-based folds); and PCA+Ridge (an auxiliary ablation for Chapter 41). Importance: date-wise permutation on the last inner validation window of each fold (3 repeats), plus joint permutation of price and feature groups; outer-test permutation importance and random-forest MDI are post hoc diagnostics only. Ablations: remove price features, use price features only, and use the top 10 features selected within training. Stability: selected parameters and IC by fold, adjacent-fold importance-rank correlation, and three seeds. Comparison statistics: daily IC differences relative to Ridge and Newey–West
Results: baseline scenario (constructed data;
| Model | IC ( |
Sharpe 0 bp | 10 bp | 20 bp | Turnover | ||
|---|---|---|---|---|---|---|---|
| OLS | −0.839% | 0.0203 (2.24) | +0.0004 (0.18) | 0.79 | 0.39 | 0.00 | 24.3 |
| Ridge | −0.113% | 0.0198 (2.22) | — | 0.84 | 0.45 | 0.07 | 23.6 |
| Lasso | −0.083% | 0.0179 (—) |
+0.0017 (—) |
0.36 | 0.01 | −0.33 | 16.3 |
| Elastic Net | −0.010% | 0.0309 (—) |
+0.0103 (—) |
1.19 | 0.81 | 0.43 | 22.0 |
| Single tree | −0.393% | 0.0054 (0.64) | −0.0144 (−1.61) | 0.21 | −0.28 | −0.75 | 35.1 |
| Random forest | +0.037% | 0.0266 (2.86) | +0.0067 (1.06) | 1.13 | 0.64 | 0.16 | 29.2 |
| Gradient boosting | +0.023% | 0.0154 (1.79) | −0.0044 (−0.61) | 0.76 | 0.22 | −0.32 | 36.2 |
| PCA+Ridge | −0.008% | 0.0135 (1.45) | −0.0063 (−0.86) | 0.62 | 0.25 | −0.13 | 23.3 |
Results: loading-reversal scenario (loading reverses from trading day 1,134; folds 11–16 occur after the reversal):
| Model | IC ( |
Sharpe 0 bp | 10 bp | 20 bp | Turnover | ||
|---|---|---|---|---|---|---|---|
| Ridge | −0.161% | 0.0087 (0.95) | — | 0.23 | −0.15 | −0.53 | 23.7 |
| Elastic Net | −0.061% | 0.0152 (—) |
+0.0061 (—) |
0.45 | 0.08 | −0.29 | 20.2 |
| Single tree | −0.604% | −0.0120 (−1.32) | −0.0207 (−2.19) | −0.66 | −1.13 | −1.60 | 36.2 |
| Random forest | −0.042% | 0.0129 (1.35) | +0.0042 (0.66) | 0.41 | −0.08 | −0.57 | 29.7 |
| Gradient boosting | −0.020% | 0.0041 (0.46) | −0.0045 (−0.59) | 0.16 | −0.38 | −0.92 | 36.5 |
| PCA+Ridge | −0.053% | 0.0063 (0.68) | −0.0023 (−0.31) | 0.24 | −0.14 | −0.52 | 23.5 |
(See the research report for OLS and Lasso; Lasso's Sharpe after 10 bp is −0.57.)
projects/project06/research_report/v2_ic_date_bases.json.
Ablations (Sharpe after 10 bp;
| Ablation | Baseline IC | Baseline |
Baseline Sharpe | Reversal IC | Reversal |
Reversal Sharpe |
|---|---|---|---|---|---|---|
| Forest: remove prices | 0.0207 | −0.0059 (−2.05) | 0.27 | 0.0082 | −0.0047 (−1.62) | −0.34 |
| Forest: prices only | 0.0131 | −0.0135 (−1.09) | −0.05 | 0.0141 | +0.0013 (0.10) | −0.14 |
| Forest: in-training top 10 | 0.0146 | −0.0120 (−1.85) | 0.28 | 0.0082 | −0.0047 (−0.77) | −0.06 |
| Boosting: remove prices | 0.0080 | −0.0074 (−1.56) | −0.22 | −0.0013 | −0.0055 (−1.14) | −0.42 |
| Boosting: prices only | 0.0145 | −0.0009 (−0.08) | 0.44 | 0.0130 | +0.0089 (0.77) | 0.19 |
| Boosting: in-training top 10 | 0.0197 | +0.0043 (0.58) | 0.14 | 0.0141 | +0.0099 (1.22) | −0.22 |
Stability. Across three random-forest seeds, IC is 0.0266, 0.0232, and 0.0237; Sharpe after 10 bp is 0.64, 0.52, and 0.44; pairwise prediction correlations range from 0.962 to 0.982. HGB with early_stopping=False is identical across all three seeds for the given data. This is implementation determinism, not data or time stability. Gradient boosting selects 2–96 rounds by fold (mostly 4–56), and 14 of 16 folds select depth 2 for the single tree. Mean adjacent-fold correlation of in-training permutation-importance rankings is −0.10 for the single tree, 0.01 for the forest, and 0.09 for boosting; noise_04 also enters the forest's top 10 in 11 folds. Group permutation: mean MSE increase is about zero for the price group (within
Interpretation.
- Prediction: No model has
relative to the training mean above 0.04%. For the tree models, the IC differences relative to Ridge on continuous dates (four-trading-day NW) are all within . The only occurs for the single tree under loading reversal, where it is worse ( ; unadjusted two-sided approximation ; about 0.17 after Bonferroni correction for the 3 tree models × 2 scenarios, with ablations and seed comparisons also registered). This is descriptive, not a confirmatory significant finding. The data-generating process is linear and gives the tree models no nonlinear structure to exploit, consistent with Sections 8.5–8.6. - Costs: Tree-model annual turnover is 29–36, higher than the linear models' 16–24 (piecewise-constant predictions jump by a full step when crossing a threshold). The random forest's pre-cost Sharpe in the baseline scenario is 1.13 but falls to 0.16 after 20 bp. Elastic Net ranks first or near first across both scenarios and all three cost levels.
- Ablation and substitutes: Removing price features lowers IC for both tree models; with price features only, boosting nearly retains its full-feature IC, while the price group's joint-permutation importance is near zero. This indicates overlapping information between price features and feature columns: past returns include slowly varying expected returns (feature AR coefficient 0.98). When feature columns are available, they can substitute for the price group, so permuting that group causes little loss; removing it can still remove an independent source of noise and some signal. In the reversal scenario, boosting with price features only does better; momentum-like features update with recent returns faster than coefficients learned on features before the reversal. These are observations from two scenarios only, with all
-statistics below 1.3. - PCA+Ridge: The selected number of components is usually 30 (10 of 16 folds in the baseline scenario), with 5 selected in five folds and 15 in one fold. Its
relative to the training mean is better than Ridge in both scenarios, and its IC is lower than Ridge in both. Its 10/20 bp Sharpe is worse in the baseline scenario, while in the reversal scenario, −0.14/−0.52 is slightly higher than Ridge's −0.15/−0.53. The 43 constructed and noise series are mutually independent, unit marginal variance, and each follows an AR(1) with coefficient 0.98. The other three price features come from the return process and are indirectly linked to the signal, so all 46 features do not form an independent, equal-variance population. Validate finite-sample PCA directions separately from predictive power (Chapter 41, Section 6.4). - Importance:
and are the only loaded features that consistently appear near the top ( has one-quarter the loading of ), but several zero-loading features also frequently enter the top 10. Without ground truth, the table cannot distinguish them.
Teaching decision criterion (not a joint threshold in the frozen JSON). If a conservative teaching criterion requires the paired IC difference to have NW claims_rule requires that constructed data not be used to claim economic value or alpha and that zero and negative results be retained; it does not register the joint threshold above. Constructed data cannot support an alpha claim, and real-data empirical work remains blocked. Full tables, fold-level records, importance CSVs, and figures are in projects/project06/research_report/v2_trees.md.
14. Chapter Summary
Trees divide feature space into rectangles and predict the mean within each region. Their split criterion balances the difference in group mean returns against sample balance (max_features may lower
15. Exercises
40-E01 (Hand-calculating a split). There are six stocks,
40-E02 (Leaf-size constraint). Use the Section 3 data with min_samples_leaf=3. Which thresholds are feasible, and what is the best split? If
40-E03 (Random-forest variance). One tree has
40-E04 (One boosting round). Use the Section 3 data and learning rate 0.25 for one round of stump boosting. Write down
40-E05 (L2 leaf value). Under squared loss, an HGB leaf has four samples with residual sum 6, l2_regularization=4, and learning rate 1. What is the leaf value? What is it at learning rate 0.1? Explain its relationship to the Ridge shrinkage factor using
40-E06 (Permutation and correlation). In the twin-feature example in Section 8.4, why is the importance of
40-E07 (Shapley values). Let
40-E08 (Early-stopping leakage). In one paragraph, explain why randomly holding out 10% of rows for early stopping on a panel produces lower validation error than test error and selects too many rounds in this panel; explain why random-row holdout is not a date-out-of-sample validation. Which two numbers in the Section 12.1 table show this directly?
40-E09 (Interpreting importance). In the main result in Section 8.6, the random forest's top three permutation-importance features are all noise. Give two reasons and name two stability measures you would include in a report.
16. Programming Exercises
40-P01 (Split search). Implement best_split(x, y, min_leaf), which returns the best threshold (the midpoint between adjacent values), gain, and two leaf values for a one-dimensional feature. Acceptance criteria: (1) the Section 3 data return DecisionTreeRegressor(max_depth=1, min_samples_leaf=min_leaf) in threshold and leaf values; (3) gain equals the closed form
40-P02 (Date-grouped round selection). For one outer fold, select the HGB round count on inner date-based folds using staged_predict (the function defaults to inner_folds=1, the final fold; use this default for this exercise. The project's two-fold setting is different). The result must match chosen_params["max_iter"] from fit_select_predict_tree with model="gbm". Acceptance criteria: (1) the two values match; (2) changing the outer test labels does not change the selected rounds or test predictions; (3) passing early_stopping=True to make_estimator raises an error.
40-P03 (Date-wise permutation). Implement permutation within each signal_time, shuffling a column independently by date. Acceptance criteria: (1) the multiset of that column's values is unchanged within each date; (2) values are never exchanged across dates; (3) a fixed model that does not read a noise column has exactly zero importance, while a model fitted on a finite sample with a truly zero-loading noise feature is not guaranteed to have exactly zero importance in that estimate, so report the repeated-estimate distribution; the signal feature should have a clearly positive importance; (4) in group permutation, all columns in a group use the same row permutation.
17. Challenge Problems
40-C01 (Interpret the Project 6 v2 results). Read the tables in Section 13 and projects/project06/research_report/v2_trees.md. (a) What is the direction of the tree models' IC differences (Newey–West
40-C02 (Real-data protocol). Write a one-page research protocol for tree models on a real daily individual-stock panel: features and their availability times, labels, outer and inner folds, grid and round selection, importance window, ablations, cost scenarios, seeds, benchmarks, and falsification conditions. Explain how you would freeze the protocol before seeing real results, and which A8-A/A8-B constructed results you have already seen and must disclose.
18. Complete Solutions
40-E01. The overall mean is 3 and
40-E02. Feasible thresholds are 3.5, 4.5, and 5.5 (at least three stocks on each side); the best is 4.5 (gain 18). When
40-E03. For
40-E04.
40-E05. The leaf value is
40-E06. The model
40-E07.
40-E08. Randomly held-out validation rows and training rows come from the same dates: they share same-day market shocks, persistent characteristics across the same stocks, and overlapping five-day labels (adjacent signal dates share four days of returns). Thus the labels of validation rows have almost been “seen” on the training side. As the model fits the training data more closely, validation error falls and early stopping is delayed, selecting too many rounds. In the table, the random-holdout validation MSE of 22.06 is about 15% below its test MSE of 26.01, and all 12 folds run to the limit of 1,000 rounds; date-based round selection has test MSE 24.72.
40-E09. Reasons: (1) the signal is weak, so the model primarily fits chance relationships between noise features and returns in the training window, and some of those relationships sometimes persist into the adjacent validation window; (2) there are only three permutation repeats, and importance is calculated on one 63-day validation window. Stability measures include the number of folds in which each feature enters the top 10 and the Spearman correlation between importance rankings in adjacent folds (0.12 on average in the main result). Group importance and ablations using price features only or characteristic features only are also useful.
40-P01 reference implementation.
import numpy as np
from sklearn.tree import DecisionTreeRegressor


def best_split(x, y, min_leaf=1):
    o = np.argsort(x, kind="stable")
    x, y = np.asarray(x, float)[o], np.asarray(y, float)[o]
    n, best = len(y), None
    sse = lambda v: float(((v - v.mean()) ** 2).sum())
    for s in range(min_leaf, n - min_leaf + 1):
        if s == 0 or s == n or x[s - 1] == x[s]:
            continue
        L, R = y[:s], y[s:]
        gain = sse(y) - sse(L) - sse(R)
        assert np.isclose(gain, s * (n - s) / n * (L.mean() - R.mean()) ** 2)
        if best is None or gain > best[1] + 1e-12:
            best = ((x[s - 1] + x[s]) / 2, gain, L.mean(), R.mean())
    return best


x8, y8 = np.arange(1, 9.0), np.array([-2, -1, -1, 0, 2, 1, 3, 2.0])
assert np.allclose(best_split(x8, y8), (4.5, 18.0, -1.0, 2.0))
rng = np.random.default_rng(0)
for leaf in (1, 5):
    x, y = rng.normal(size=60), rng.normal(size=60)
    t = DecisionTreeRegressor(max_depth=1, min_samples_leaf=leaf).fit(x[:, None], y)
    thr, gain, l, r = best_split(x, y, leaf)
    assert np.isclose(thr, t.tree_.threshold[0])
    assert np.allclose([l, r], t.tree_.value[1:, 0, 0])
assert best_split(x8, np.ones(8))[1] == 0.0
assert best_split(np.ones(8), y8) is None
assert best_split(x8, y8, min_leaf=5) is None
print("ok")
40-P02 reference implementation.
import numpy as np, pytest
from quant_course import ml_pipeline as mp, tree_models as tm
close, chars = tm.simulate_interaction_panel(n_assets=10, n_days=400, n_noise=3,
                                             signal_loading=2e-3, seed=2)
labels = mp.make_forward_labels(close, horizon=5, execution_lag=1)
X = mp.stack_features(chars, labels.index)
f = mp.date_walk_forward(labels.index.get_level_values(0), labels["label_start"],
                         labels["label_end"], labels["label_available_at"],
                         min_train_dates=250, test_dates=40)[0]
grid = [{"max_iter": 40, "learning_rate": 0.1, "max_depth": 2, "min_samples_leaf": 50}]
kw = dict(model="gbm", param_grid=grid, inner_folds=1,
          inner_val_dates=40, inner_min_train_dates=120)
res = tm.fit_select_predict_tree(X, labels, f, **kw)
xtr, ytr = X.iloc[f.train_rows], labels["y"].iloc[f.train_rows]
ok = xtr.notna().all(axis=1) & ytr.notna()
lab = labels.iloc[f.train_rows][ok]
inner = mp.date_walk_forward(lab.index.get_level_values(0), lab["label_start"],
                             lab["label_end"], lab["label_available_at"],
                             min_train_dates=120, test_dates=40)[-1]
xi, yi = xtr[ok], ytr[ok]
est = tm.make_estimator("gbm", grid[0], seed=0)
est.fit(xi.iloc[inner.train_rows], yi.iloc[inner.train_rows])
yv = yi.iloc[inner.test_rows].to_numpy()
curve = [np.mean((yv - p) ** 2) for p in est.staged_predict(xi.iloc[inner.test_rows])]
assert int(np.argmin(curve)) + 1 == res.chosen_params["max_iter"]
lab2 = labels.copy()
lab2.iloc[f.test_rows, lab2.columns.get_loc("y")] = 9.9
res2 = tm.fit_select_predict_tree(X, lab2, f, **kw)
assert res2.chosen_params == res.chosen_params
assert res2.predictions.equals(res.predictions)
with pytest.raises(ValueError):
    tm.make_estimator("gbm", {"early_stopping": True}, seed=0)
print(res.chosen_params["max_iter"])
40-P03 reference implementation.
import numpy as np, pandas as pd
from quant_course import tree_models as tm
rng = np.random.default_rng(5)
dates = pd.bdate_range("2020-01-01", periods=60)
idx = pd.MultiIndex.from_product([dates, [f"A{i}" for i in range(15)]])
X = pd.DataFrame({"sig": rng.normal(size=len(idx)), "noise": rng.normal(size=len(idx)),
                  "twin": 0.0}, index=idx)
X["twin"] = X["sig"]
y = pd.Series(0.5 * X["sig"].to_numpy() + rng.normal(scale=0.5, size=len(idx)), index=idx)
predict = lambda d: 0.5 * d["sig"].to_numpy()  # a model that reads 'sig' only
imp = tm.permutation_importance_by_date(predict, X, y, n_repeats=5, seed=0)
assert imp.loc["sig", "d_mse_mean"] > 0.3
assert abs(imp.loc["noise", "d_mse_mean"]) < 1e-12 and imp.loc["twin", "d_mse_mean"] == 0
g = tm.permutation_importance_by_date(predict, X, y, groups={"pair": ["sig", "twin"]},
                                      n_repeats=5, seed=0)
assert g.loc["pair", "d_mse_mean"] > 0.3
print(imp["d_mse_mean"].round(3).to_dict())
The multiset, no-cross-date, and joint group-permutation properties should also be checked directly, rather than relying only on the importance output:
Xp = X.copy()
for date in X.index.get_level_values(0).unique():
    loc = np.flatnonzero(X.index.get_level_values(0) == date)
    order = rng.permutation(len(loc))
    # Read and write within the same date; paired columns use the same order.
    Xp.iloc[loc, X.columns.get_indexer(["sig", "twin"])] = (
        X.iloc[loc[order]][["sig", "twin"]].to_numpy())
    assert sorted(Xp.iloc[loc]["sig"]) == sorted(X.iloc[loc]["sig"])
    assert sorted(map(tuple, Xp.iloc[loc][["sig", "twin"]].to_numpy())) == (
        sorted(map(tuple, X.iloc[loc][["sig", "twin"]].to_numpy())))
assert np.array_equal(Xp["sig"], Xp["twin"])
Here, a fixed model that does not use noise gives exactly zero importance; a model fitted on data may happen to use noise, and its finite-sample permutation importance can be positive or negative. With multiple inner folds, average the validation MSE across the same active folds at each round and select the minimum; do not use only the final fold.
40-C01 complete reference answer. Sharpe differences below subtract the two-decimal values shown in the tables, rather than rounding differences calculated from the raw summaries. In the baseline scenario, the paired
For the forest, removing price features lowers IC in both scenarios; Sharpe after 10 bp falls from 0.64 to 0.27 in the baseline scenario and from −0.08 to −0.34 after reversal. Forest results using price features only are −0.05/−0.14. For boosting, removing prices gives Sharpe of −0.22/−0.42, while using prices only gives 0.44/0.19, above the full-feature results of 0.22/−0.38. Using the top 10 features gives forest Sharpe of 0.28/−0.06 and boosting Sharpe of 0.14/−0.22, so improvement is inconsistent. Price features are derived from a return path that includes slowly varying expected returns and overlap in information with the noise_04 and
Across three forest seeds, IC values are 0.0266, 0.0232, and 0.0237, and Sharpe after 10 bp is 0.64, 0.52, and 0.44; pairwise prediction correlations range from 0.962 to 0.982. High prediction correlation can coexist with a 0.20 Sharpe difference. HGB with built-in early stopping disabled is identical across three seeds for the given data; this is implementation determinism, not data or time stability. All results are constructed, multiple comparisons are unadjusted, and most after-cost values are negative under loading reversal. Importance cannot provide causal interpretation. Together, these facts contradict the claim that the model “discovered market alpha.”
40-C02 complete protocol example. This is a research design that could be frozen separately once authorized data become available; it does not claim that authorization has been granted or that the study has been run. Use a licensed point-in-time daily individual-stock panel. Preserve raw unadjusted closes, volume, splits and dividends, delisted stocks, and dated index membership. Record available_at for each field and use the signal cutoff time
Form the signal at the close of max_features=0.33 and leaf sizes 500/2,000; and HGB with at most 300 rounds, learning rates 0.02/0.05, depths 2/3, minimum leaf size 500, and round selection by average inner MSE with random early stopping disabled. Lock all grids and seeds 6061/6062/6063 before seeing results.
Compute importance by date on inner validation windows, using joint permutation of price and feature groups; test-window importance is diagnostic only. Register three ablations: remove price features, use prices only, and use the top 10 features selected within training. Report cases with no improvement. Center each cross-section's portfolio weights and set total absolute weight to 1; rebalance every five days. Show costs at 0/10/20 bp, and state that borrow fees, financing, market impact, and capacity are not modeled. Report paired IC differences on common dates, missing-date counts,
Pre-specify an adoption rule requiring paired advantages under both scenarios and better performance than linear benchmarks after 20 bp, with multiple-comparison handling determined in advance. Do not adopt if the advantage occurs only in one window or seed, or only before costs. A
19. Further Reading
- Must know: Breiman (2001), “Random Forests,” Sections 1–2 and 11: the forest strength–correlation decomposition. Hastie, Tibshirani, and Friedman, The Elements of Statistical Learning, 2nd edition, Sections 9.2 (trees), 10.10–10.12 (gradient boosting and shrinkage), and 15.2 (Equation 15.1, forest variance).
- Should know: Friedman (2001), Section 3 (the pseudo-residual algorithm) and Section 5 (shrinkage). scikit-learn 1.9.1 user guide, “Permutation feature importance” (its relationship to MDI and the warning about correlated features). Gu, Kelly, and Xiu (2020), Sections 1.1 and 2.2: tree-model setup and scale in monthly cross-sections.
- Advanced: Strobl et al. (2007, 2008): bias in variable importance and conditional permutation importance. Lundberg and Lee (2017), and Lundberg et al. (2020): SHAP and TreeSHAP. Aas, Jullum, and Løland (2021), and Janzing et al. (2020): tradeoffs between conditional and interventional definitions with correlated features.
- Optional: sklearn
HistGradientBoostingRegressorsource: lines 533–581 ofgradient_boosting.pyandcompute_node_valueinsplitting.pyx.
20. References
“Read by the author” below refers to the original course author’s historical review recorded in source_notes. BIL19 inherits that status; this revision did not reopen the original publications or perform a new online source review.
Full links and reviewed locations are listed in references.md, references/sources.json, and this chapter's source_notes.md.
- SK_PITFALLS: scikit-learn, “Common pitfalls.” Used in Sections 7 and 12.3 for preprocessing within training data. Review: inherited from the A8-A registration.
- SK_TREE_SRC: local sklearn 1.9.1 source:
tree/_classes.py(warning in thefeature_importances_docstring);ensemble/_forest.py(RandomForestRegressordefaultmax_features=1.0);ensemble/_hist_gradient_boosting/gradient_boosting.py, lines 533–581 (early_stopping="auto"andtrain_test_split);splitting.pyx,compute_node_value(); and grower.py(shrinkage =learning_rate). Used in Sections 5, 6.3–6.4, and 12.1. Review: read by the author (local source). - CH37_GKX2020: Gu, S., Kelly, B., & Xiu, D. (2020). “Empirical asset pricing via machine learning.” RFS, 33(5), 2223–2274. Used in Sections 2 and 11. Review: read by the author: pages 2248–2249 on sample and splits, footnote 32, page 2251 on RF 0.33% / GBRT+H 0.34% and shallow trees, and page 2252 on 0.52%–0.70% for large-cap stocks.
- CH40_BREIMAN2001: Breiman, L. (2001). “Random forests.” Machine Learning, 45, 5–32. Used in Sections 5, 6.2, and 19. Review: reconnaissance report (R).
- ESL_2ND_ED: Hastie, Tibshirani, and Friedman (2009). The Elements of Statistical Learning, 2nd ed. Used for Equation (15.1) in Section 6.2 and Section 6.3. Review: reconnaissance report (R: Section 15.2, p. 588, Equation 15.1); not reread by the author.
- CH40_FRIEDMAN2001: Friedman, J. H. (2001). “Greedy function approximation: a gradient boosting machine.” Annals of Statistics, 29(5), 1189–1232. Used in Section 6.3. Review: reconnaissance report (R).
- CH40_STROBL2007, CH40_STROBL2008: Strobl et al. (2007), BMC Bioinformatics, 8:25; and (2008), 9:307. Used in Section 6.5. Review: reconnaissance report (R); full texts not read by the author.
- CH40_LL2017, CH40_LUNDBERG2020: Lundberg and Lee (2017), NeurIPS; Lundberg et al. (2020), Nature Machine Intelligence, 2, 56–67. Used in Section 5 and Section 6.6. Review: reconnaissance report (R).
- CH40_AJL2021: Aas, Jullum, and Løland (2021). Artificial Intelligence, 298, 103502. Used in Section 6.6. Review: reconnaissance report (R).
- SK_PERMIMP_DOC: scikit-learn user guide, “Permutation feature importance.” Used in Sections 5 and 6.5. Review: reconnaissance report (R); author checked the sklearn 1.9.1 warning in the MDI docstring.
For specific passages and source assignments, see course/zh/chapters/ch40/source_notes.md.
Notebook Reader's Guide
The I3 Chapter 40 notebook has 11 cells, including 5 code cells. It freshly computes the hand-calculation checks and the seven-model fivefold interaction panel, and writes two figures to a new RUN_DIR; it does not read an old cache. It does not run the full CLI's four panels or all importance calculations; the fivefold run remains a D11 post hoc diagnostic. Notebook language handling is being done in BIL23; this batch did not run or modify the notebook.