CHAPTER 37/ 45
. A Foundational Stance on Machine Learning for Finance
Central point: predictive accuracy can improve while investment results after costs deteriorate; financial machine learning must evaluate prediction, decision, cost, and evidence on the same ledger. Prerequisites: Chapter 7, Statistical Inference; Chapter 22, Research Methods and Multiple Testing; Chapter 31, Model Validation; Chapter 35, Transaction Costs. After this chapter, you should be able to explain with a hand-computable counterexample why accuracy and net returns can diverge; state how overlapping labels, regime shifts, and multiple attempts affect the strength of evidence; and provide an evaluation checklist covering out-of-sample performance, stability, costs, tails, and economic logic.
1. Learning Objectives
After reading this chapter, you should be able to complete these six verifiable tasks:
- Given a set of daily returns and long-short positions, calculate directional accuracy, gross returns, turnover, costs, and net returns by hand, and write the identity relating accuracy to returns,
( ). - Explain four structural challenges in financial prediction—non-stationarity, low signal-to-noise ratio, temporal dependence, and regime shifts—and give one runnable numerical example for each.
- Calculate the expected in-sample Sharpe ratio of the best of
strategies with zero true returns, and explain why it is not a discovery. - Classify data leakage into five types—target leakage, look-ahead features, preprocessing leakage, selection leakage, and overlapping-label leakage—and give one erroneous implementation and its repair for each.
- Describe how financial problems differ from Kaggle-style competitions in their data-generating process, test sets, and evaluation metrics, and choose baselines accordingly.
- Set evaluation gates for Chapters 38–40 and Project 6: check out-of-sample performance, stability, costs, tails, and economic logic together.
Completion criteria: independently solve every question in Sections 15–17, with answers consistent with Section 18; explain the inputs, outputs, and limitations of the historical cached results in Section 9. The distinction between the default reader entry point and rerun identity is also described in Section 9; this batch does not rerun simulations.
2. Why Quant Needs This
Suppose you are reviewing a daily directional prediction model. The researcher reports that test-set accuracy in predicting up versus down rose from 52% to 55%. That figure might lead you to approve deployment, or it might lose you money. Accuracy treats every day as equally important, while portfolio returns are booked in proportion to each day’s return magnitude. A model can guess correctly on 100 quiet days and miss on 3 crash days, achieving high accuracy while losing money. If the model also reverses its position every day, transaction costs can consume the remaining profit.
Earlier chapters prepared the pieces. Chapter 7 covers sampling error in estimators; Chapter 22 covers freezing research plans and multiple testing; Chapter 31 covers label intervals, purging, and walk-forward evaluation; and Chapter 35 covers costs. This chapter places those pieces in a machine-learning context and asks a more fundamental question: when training a prediction model in finance, what are you optimizing, and why should you believe the result?
This chapter does not train a complex model. Chapter 38 builds a date-based pipeline with fitting confined to training data; Chapter 39 makes controlled comparisons using regularized linear models; Chapter 40 introduces tree models. The conclusions here become their acceptance gates.
From Prediction Scores to an Account: Fix Three Tables First
Keep three tables in view as you read these chapters: an information table records what was available to read when the model was fitted and a decision was made; a prediction table records the dates, assets, and predictions; and a ledger records when trades occurred, how positions changed, and how much cost was paid. This chapter first links the last two tables; Chapter 38 completes the information table; Chapter 39 compares estimators within the same pipeline.
That path also determines the comparison order: first fix the clock and baselines, then select models with training-only validation, and finally report both prediction-level and portfolio-level results for a frozen test period. Seeing higher accuracy does not let you skip execution and costs and read the result directly as higher net returns.
3. Intuition
Start with a ten-day constructed example (for teaching, not market data). One asset has the following open-to-open returns (%) over ten days:
Days 5 and 10 are two large declines; the other eight days have small moves. Each model predicts a direction every day, and you hold one unit long (
- Model B guesses correctly on all eight small-move days and predicts an increase on both large-decline days. Its accuracy is 80%.
- Model A misses on three small-move days and predicts a decline on both large-decline days. Its accuracy is 70%.
Accuracy alone would lead you to choose B. Look at the account instead: on each of the two large-decline days, B loses the full size of the decline, while A earns that amount. Correct or incorrect calls on small days are worth only a few tenths of a percentage point; on large days they are worth several percentage points. B also reverses its position on Days 3 and 8, so it turns over more than A. Section 8 calculates that, after a cost of 0.1% per unit of turnover, A earns about +5.69% compounded over ten days while B loses about 4.00%.
The example is deliberately small. Its purpose is to make the mechanism visible: accuracy and profitability aggregate the same sequence of correct and incorrect calls with different weights. In real data, fat-tailed returns let a small number of days determine much of the profit and loss, strengthening this mechanism. The simplifying boundaries should also be clear: positions are only
4. Mathematical Foundations
The notation used in this chapter is as follows. All observations are daily, and returns are decimals (0.004 means 0.4%).
| Symbol | Meaning | Unit / dimension |
|---|---|---|
| Trading-day index | Dimensionless | |
| Simple return from the open on Day |
Decimal per day | |
| Directional prediction made by the model after the close on Day |
Dimensionless | |
| Position established at the open on Day |
Wealth multiple | |
| Whether the direction was correct on Day |
0 or 1 | |
| Cost per unit change in position | Decimal (proportion of wealth) | |
| Turnover on Day |
Wealth multiple | |
| Wealth at the end of Day |
Currency units (normalized) |
Timing convention: the signal time is the close on Day lag>=1. This ten-day example uses open execution to make hand calculations easy. Chapters 38 and 39 and Project 6 have only closing prices, so they use “execute at the close of the next trading day after the signal close, with the label starting at the execution close.” Both conventions are internally consistent; do not mix them.
Statistical tools used here: the variance of a sample mean, the relationship between correlation and the coefficient of determination (Chapters 7 and 8), and the maximum of normal random variables (Chapter 32; multiple-testing principles in Chapter 22). If the expression for
5. Formal Definitions
Prediction and decision. A prediction is a mapping from an information set to an estimate of a target variable,
Directional accuracy / hit rate. On days when
Magnitude-weighted accuracy.
Boundary of the teaching-proxy ledger. This chapter uses the absolute change in target position,
Net returns and the wealth path. Net return on Day
Non-stationarity. The process is non-stationary if the joint distribution of
Regime shift. One form of non-stationarity: there is a date
Signal-to-noise ratio. For
Temporal dependence. Observations are correlated with one another. The positive correlation in the overlap structure studied here reduces the effective information available for estimating the mean, although under negative autocorrelation the effective sample size can also exceed the number of observations. The focus here is overlapping labels: computing a future
Multiple testing and selection bias. Try
Data leakage. Data leakage occurs when information unavailable at prediction time is used to train or select a model. This chapter classifies five routes by which the information enters: target leakage (a feature is constructed from the label itself or its future portion); look-ahead features (the feature becomes available after the signal time); preprocessing leakage (scaling, imputation, or dimensionality reduction uses test data); selection leakage (the test set is used to select a model, feature, or threshold); and overlap leakage (training-label intervals intersect test-label intervals). All five mix information unavailable at deployment into test performance.
Baseline. A simple rule compared with a candidate model on the same sample, under the same timing convention and costs. This book uses three defaults: a zero prediction (no position), the training-mean prediction, and a simple rule (such as buy-and-hold or the momentum rule in Chapter 25). An out-of-sample number without a baseline cannot be interpreted.
Out-of-sample
These concepts have a logical order: the prediction–decision distinction tells you what to evaluate; non-stationarity, low signal-to-noise ratio, and temporal dependence explain why evidence is weak; multiple testing and leakage explain how evidence can be artificially inflated; and baselines and
6. Derivations
6.1 The Identity Between Accuracy and Gross Returns
Assumptions:
First, write one-day gross return according to whether the direction is correct. If
Second, sum over
The last equality follows from the definition of magnitude-weighted accuracy. Gross returns are positive if and only if
Use: This identity shows that classification loss (0–1 loss) and investment loss are not the same objective. When you train a directional model with cross-entropy or accuracy, errors on large- and small-move days receive equal weight; the investor’s cost is weighted by
6.2 Costs Separate Net Returns
Reversing a
6.3 Signal-to-Noise Ratio and
Assumptions:
Also,
This does not mean the signal is useless. Chapter 23 already shows that a portfolio constructed cross-sectionally with weights
6.4 Autocorrelation and Effective Sample Size for Overlapping Labels
Assumptions: Daily returns
For
The second equality uses
For finite
Scope: if daily returns themselves are autocorrelated or exhibit volatility clustering,
6.5 The Maximum Sharpe Ratio Across Multiple Attempts
Assumptions: The daily returns of
The first approximation comes from the normal approximation. research_protocol module) or by the Bailey–López de Prado approximation
Use: when you see “the best model selected from 100 feature combinations had an annualized Sharpe of 1.8,” first compare it with 1.77. It is nearly the expected value under the zero null and is not a discovery. Chapter 32 discusses the Deflated Sharpe Ratio; trial registration and multiple-testing principles are covered in Chapter 22. The expected maximum is a reference point, not an exact post-selection
6.6 Out-of-Sample
Assumptions:
Conditional on the fitted fixed
7. Financial Interpretation
Why large days determine profit and loss. Daily returns are fat-tailed: the absolute returns on a small number of days are far larger than those on a typical day (Chapters 11 and 33). The sum
Why a low signal-to-noise ratio is the norm. If a publicly available signal could predict returns reliably and by a large amount, traders would buy assets predicted to rise until the expected returns were absorbed into prices. Any remaining discoverable predictability is therefore small or requires risk or costs as compensation (the factor-premium explanation in Chapters 14 and 24–27). So a “very low
Why relationships change. Market participants learn and exploit published patterns; regulation, market structure, and interest-rate regimes change; and capital flowing into the same strategy compresses its returns. These all make
How this differs from Kaggle-style competitions. Use competitions that allow repeated public-leaderboard submissions and assume approximately identically distributed data as a simplified contrast; individual competitions may instead have time-based splits, submission limits, and distribution shifts. In finance, you have only one historical path, and a test period can truly be used only once; distributions drift over time; the objective is risk-adjusted returns after costs rather than a prediction metric; and your trades affect prices and costs (Chapters 35 and 36). Common competition techniques such as random shuffling followed by K-fold cross-validation or repeated tuning against a public leaderboard can introduce overlap leakage under the overlapping-label structure studied here, while repeated testing and tuning introduce selection leakage. Diagnose the specific problems with random splits from the information and label structure.
Implementability. A model’s value depends on whether its predictions can be computed before trade_time, traded at a reasonable cost, and scaled under capacity and borrow constraints. These are not included in the model’s loss function and must be added to the evaluation.
8. Numerical Example
8.1 Ten-Day Case: Inputs
(Constructed for teaching.) Daily returns
| Day |
1 | 2 | 3 | 4 | 5 | 6 | 7 | 8 | 9 | 10 |
|---|---|---|---|---|---|---|---|---|---|---|
| +0.4 | +0.3 | −0.2 | +0.5 | −3.0 | +0.4 | +0.2 | −0.1 | +0.3 | −2.5 | |
| +1 | +1 | −1 | +1 | +1 | +1 | +1 | −1 | +1 | +1 | |
| +1 | +1 | +1 | +1 | −1 | −1 | −1 | −1 | +1 | −1 | |
| +1 | +1 | +1 | +1 | +1 | +1 | +1 | +1 | +1 | +1 |
8.2 Hand-Calculating Accuracy and Gross Returns
- B: wrong on Days 5 and 10, so
. . Gross return . . - A: wrong on Days 3, 6, and 7, so
. . Gross return . . - Buy-and-hold: wrong on the 4 down days, so
, , and gross return .
Check A against the identity
8.3 Turnover and Costs
- B:
(1), Day 3 (2), Day 4 (2), Day 8 (2), and Day 9 (2). Total: 9 units; cost: . - A: initial position 1, Day 5
(2), Day 9 (2), and Day 10 (2). Total: 7; cost: 0.7%. - Buy-and-hold: 1; cost: 0.1%.
8.4 Net Returns: Approximate and Exact
| Acc | Sum of gross returns | Turnover | Cost | Additive approximate net return | Exact compounded net return | ||
|---|---|---|---|---|---|---|---|
| A | 0.70 | 0.899 | +6.30% | 7 | 0.70% | +5.60% | +5.6879% |
| B | 0.80 | 0.304 | −3.10% | 9 | 0.90% | −4.00% | −3.9980% |
| Buy-and-hold | 0.60 | 0.266 | −3.70% | 1 | 0.10% | −3.80% | −3.8072% |
| Zero position | — | — | 0 | 0 | 0 | 0 | 0 |
The exact column comes from course/zh/chapters/ch37/figures/ch37_results.json; its 11 wealth points correspond to 10 daily returns. Model B, despite having the highest accuracy, loses to the zero-position baseline as well as to buy-and-hold.
8.5 A Hand Calculation for the Scale of
If a feature has correlation 0.03 with next-day returns, then
9. Python Implementation
Script: code/ch37_ml_philosophy.py. The historical engineering script can recompute the constructed experiments; even if a new --out is specified, the working-tree version may overwrite the chapter’s original figures, so this chapter does not provide a direct overwrite instruction. The Chapter 37 Notebook in the default reader package recomputes the ten-day case, 100,000 overlapping days, three groups of 200 zero-signal experiments each, and the regime shift, then writes the ten-day wealth chart in a unique run directory; this batch explains that behavior only and did not execute it. Historically, the CLI calculated
Inputs consist only of teaching parameters defined inside the script and fixed seeds (3701 for the regime shift, 3702 for multiple testing, and 3703 for overlapping labels); outputs are ch37_results.json (which refuses to overwrite an existing file) and three figures. Data frequency is daily. In the ten-day case, signal_time is the previous day’s close, trade_time is the current day’s open, and the return interval runs from the open to the next open. Missing-data policy: if an input contains NaN or inf, raise an error; do not impute.
Core functions:
decision_ledger(returns, positions, cost_per_unit): returns daily gross returns, turnover, net returns, andwealth points. magnitude_identity(returns, positions): checks the identity in Section 6.1.overlap_autocorrelation(h, n_days, seed): sample autocorrelations and theoretical valuesfor overlapping labels. max_null_sharpe(n_strategies, n_days, n_sims, seed): best in-sample Sharpe under zero true signal and the selected strategy’s holdout Sharpe; reuses Chapter 32’squant_course.research_protocol.expected_max_standard_normal(_exact).regime_shift(n_per_regime, slope, seed): trains in Regime 1 and evaluates in Regime 2.
Tests: tests/test_ch37_philosophy.py. The following snippet can be run on its own to check the ten-day case:
import numpy as np

r = np.array([0.004, 0.003, -0.002, 0.005, -0.030, 0.004, 0.002, -0.001, 0.003, -0.025])
models = {
    "A": np.array([1, 1, 1, 1, -1, -1, -1, -1, 1, -1]),
    "B": np.array([1, 1, -1, 1, 1, 1, 1, -1, 1, 1]),
}
kappa = 0.001
for name, p in models.items():
    turnover = np.abs(np.diff(np.concatenate([[0], p])))
    net = p * r - kappa * turnover
    wealth = np.concatenate([[1.0], np.cumprod(1 + net)])
    acc = np.mean(np.sign(p) == np.sign(r))
    assert np.isclose((p * r).sum(), (np.abs(r) * (2 * (np.sign(p) == np.sign(r)) - 1)).sum())
    print(name, f"acc={acc:.2f}", f"turnover={turnover.sum()}", f"net={wealth[-1] - 1:+.6f}", f"points={wealth.size}")
Expected output: A acc=0.70 turnover=7 net=+0.056879 points=11 and B acc=0.80 turnover=9 net=-0.039980 points=11.
Other values from the historically frozen run (ch37_results.json):
- Overlapping labels,
, 100,000 daily samples: sample autocorrelations ; theoretical values . - Multiple testing,
days and 200 simulations: for , simulated mean best in-sample annualized Sharpe ratios were 1.138, 1.814, and 2.304; formula values were 1.088, 1.773, and 2.292; mean Sharpe ratios of the selected strategies in equal-length holdout periods were , , and . The zero-signal construction makes the population expectation for an independent holdout period 0, but finite Monte Carlo means can differ; do not characterize all three groups alike as “indistinguishable from 0.” For cached , the mean over 200 runs was 0.10456881, the descriptive standard error was 0.04797481, and the ordinary normal-approximation 95% interval was about [0.01054, 0.19860]. This is a post hoc description of cached results, not a new preregistered test and not market alpha. - Regime shift, 1,000 observations per regime and
: the estimated Regime 1 slope was ; in Regime 2, relative to zero prediction was ; within each regime the population was . Substituting into the formula from Section 6.6 gives . The difference from the simulated result comes from finite-sample variation in and intercept estimation.
10. Visualization
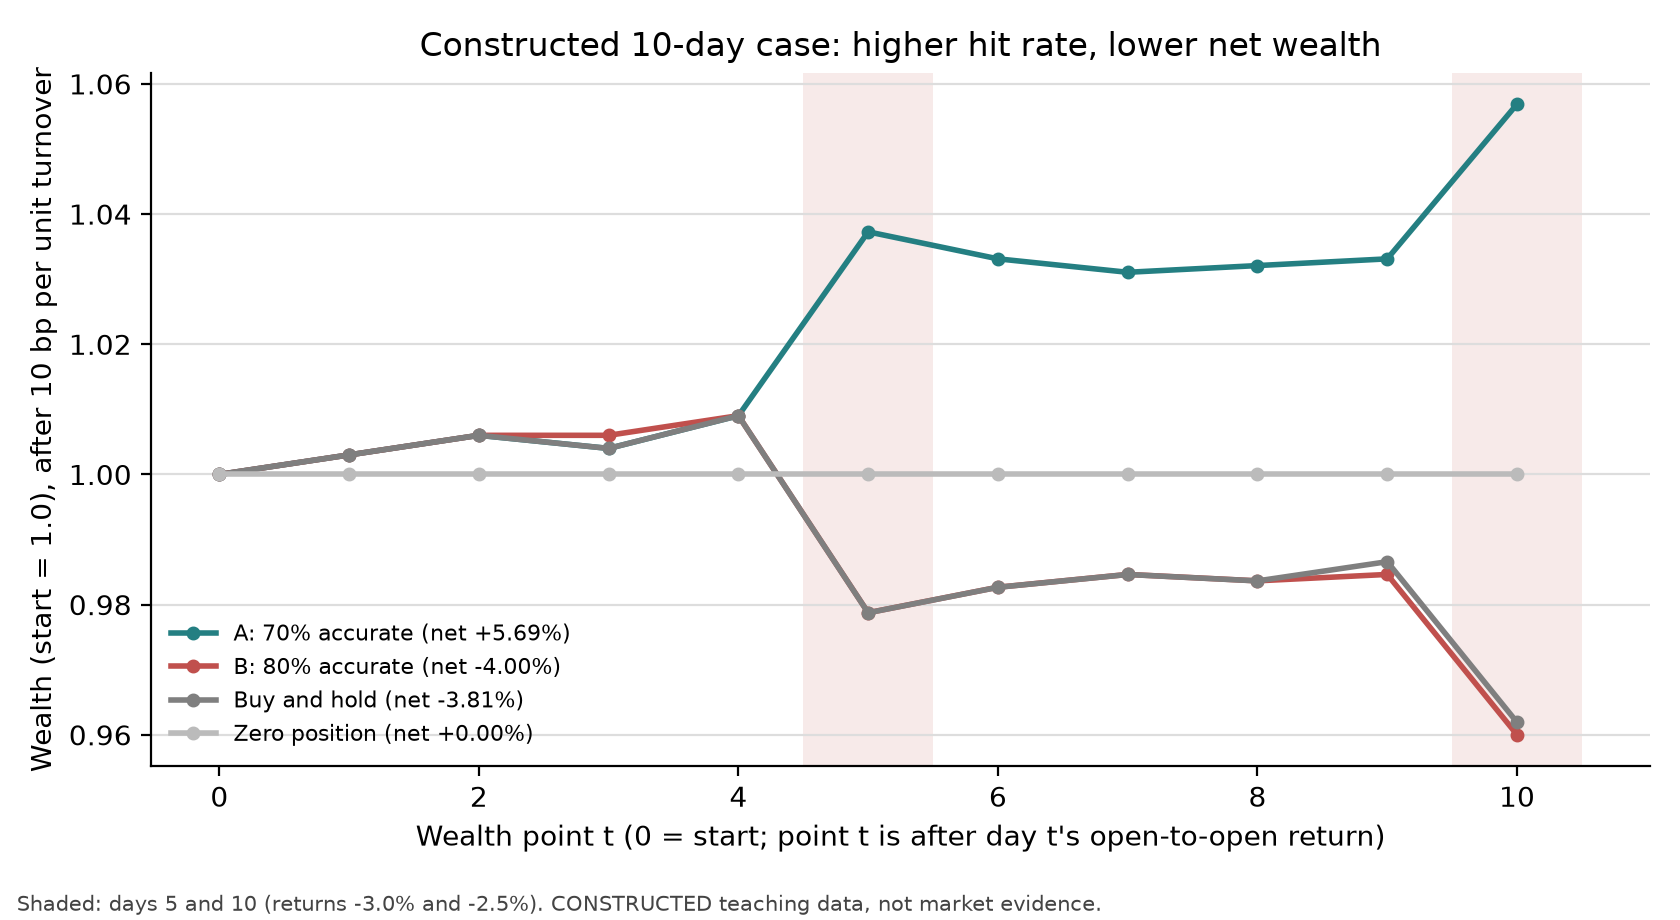
Figure 37-1: The horizontal axis is the wealth-point index (0 is the starting point; point
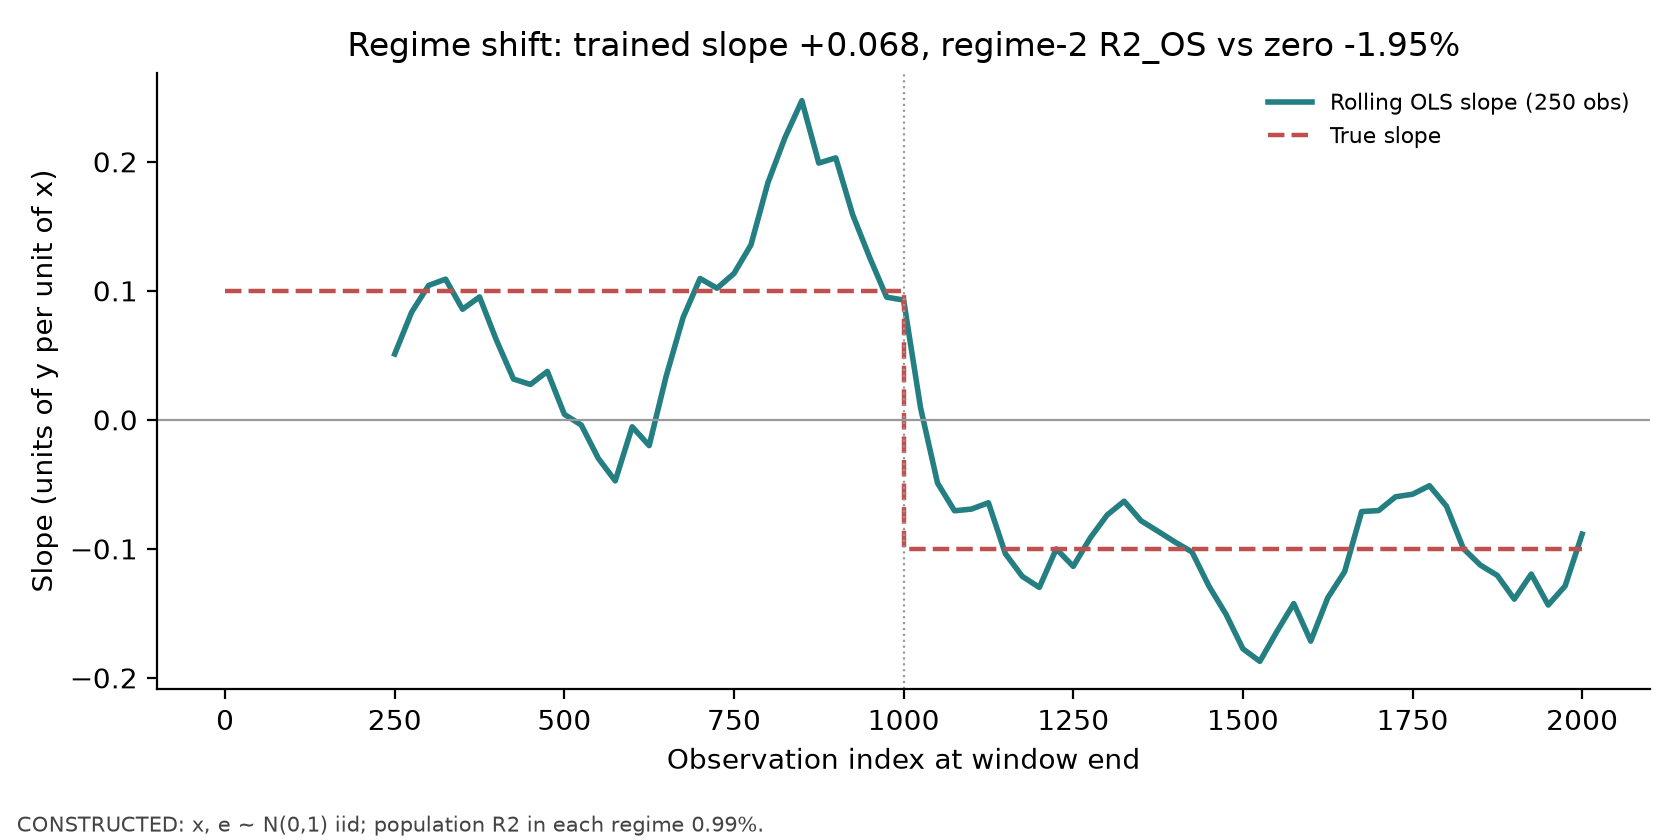
Figure 37-2: The horizontal axis is the observation index at the end of a rolling window; the vertical axis is the OLS slope of
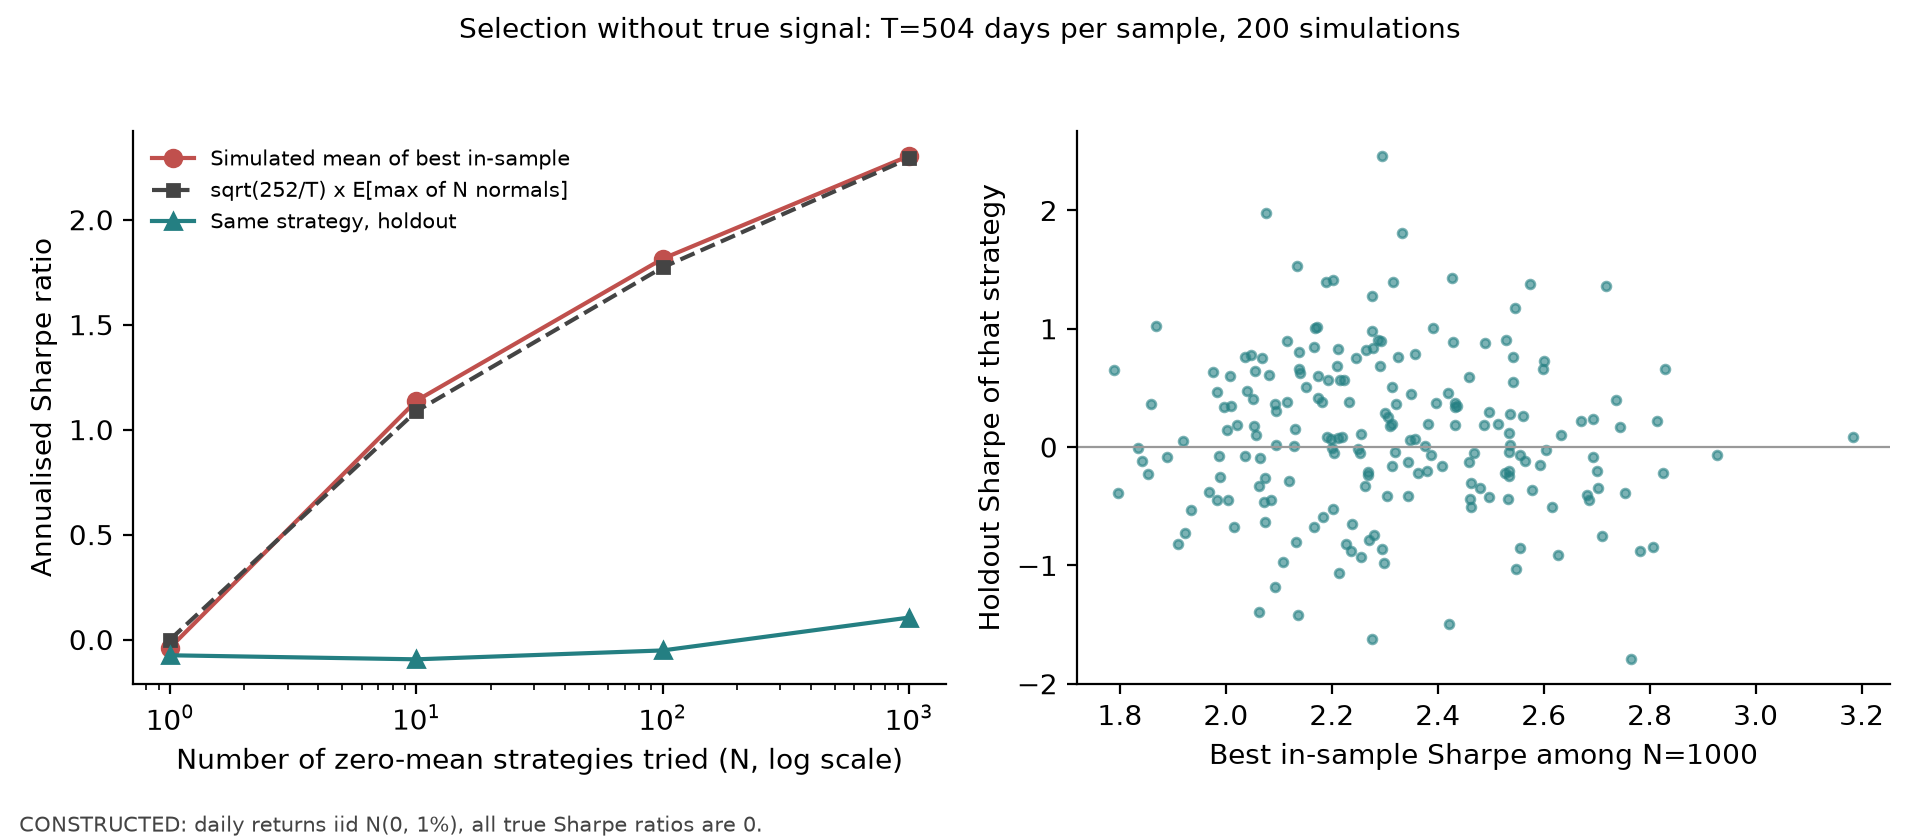
Figure 37-3: In the left panel, the horizontal axis is the number
11. Real-Market Example
This chapter reports no measured real-market results. The reason is that the course currently has no licensed daily individual-stock price panel available for internal training (the Project 5 data decision documented terms restrictions for sources such as Yahoo, Alpha Vantage, and Tiingo); the real-data status for Project 6 is blocked. Without data, this section states only how a real test should be conducted and what can be supported by the literature.
The test to conduct once data are available. Fix the stock universe and sample period in advance; use features available at the close to predict returns from the next trading day’s open to open; and, in a date-based walk-forward test, report together: directional accuracy, magnitude-weighted accuracy, IC and
What the literature can support. The following are passages the author actually read in the cited papers (see source_notes.md for details). They use other authors’ samples and definitions; they are not measurements from this book:
- Gu, Kelly, and Xiu (2020, RFS) conduct large-scale machine-learning predictions of monthly excess returns on U.S. equities. Equation (19) (p. 2249) defines out-of-sample
relative to a zero prediction, without subtracting the mean; the authors explain that for individual stocks, historical-mean predictions are typically much worse than zero predictions, and switching to the historical mean as the baseline raises monthly by about three percentage points for all methods. In Table 1 (p. 2250), OLS with all features has ; OLS using only size, value, and momentum has 0.16%; and elastic net with Huber loss has 0.11%. The text reports that a three-layer neural network reaches about 0.40%. In the introduction, the same paper reports annualized out-of-sample Sharpe ratios of 1.35 (value-weighted) and 2.45 (equal-weighted) for a decile long-short portfolio sorted by neural-network predictions. These figures illustrate two things at once: individual-stock monthly is below 1%, and low can coexist with a substantial portfolio Sharpe ratio. These are before-cost figures; the equal-weighted result is more sensitive to small-cap stocks and costs. - Campbell and Thompson (2008; NBER working paper w11468 version, Equation (1), p. 5) define market-index-return
relative to the historical mean through the previous period, and note that even a small out-of-sample can be economically meaningful to investors.
The two papers use different baselines: zero for cross-sectional stock predictions, and the historical mean for index timing. Chapters 38 and 39 and Project 6 in this book report both baselines and state what each means.
12. Common Mistakes
12.1 Choosing a Trading Model by Accuracy
Error: rank models on test-set accuracy and select B. Why it is wrong: accuracy weights each day equally, while trading returns are weighted by
import numpy as np
r = np.array([0.004, 0.003, -0.002, 0.005, -0.030, 0.004, 0.002, -0.001, 0.003, -0.025])
A = np.array([1, 1, 1, 1, -1, -1, -1, -1, 1, -1]); B = np.array([1, 1, -1, 1, 1, 1, 1, -1, 1, 1])
acc = lambda p: np.mean(np.sign(p) == np.sign(r))
wrong_choice = max(("A", A), ("B", B), key=lambda kv: acc(kv[1]))[0]          # Wrong: choose by accuracy
pnl = lambda p: (p * r).sum() - 0.001 * np.abs(np.diff(np.concatenate([[0], p]))).sum()
right_choice = max(("A", A), ("B", B), key=lambda kv: pnl(kv[1]))[0]           # Fix: choose by after-cost return
print(wrong_choice, right_choice, round(pnl(A), 4), round(pnl(B), 4))          # B A 0.056 -0.04
Fix: evaluate with an objective aligned to the decision and report at least accuracy, magnitude-weighted accuracy, and after-cost returns.
12.2 Ignoring Turnover
Error: report only gross returns. Why it is wrong: a model that reverses direction has high turnover; in the ten-day example, B’s 0.9% cost exceeds A’s 0.7%, and an illustrative annualization must first divide the ten-day cumulative cost by 10 to obtain a daily mean, then multiply by 252. Do not multiply the ten-day cumulative difference directly by 252; this extrapolation does not guarantee a constant future turnover rate. Fix: include turnover and costs in the same evaluation table; use the cost definition from Chapter 35.
12.3 Selecting the Best Strategy on the Full Sample, Then Reporting It on the Same Sample
Erroneous code (zero true signal, 100 strategies; choose the best and report its in-sample Sharpe):
import numpy as np
rng = np.random.default_rng(0)
ins, outs = rng.normal(0, 0.01, (504, 100)), rng.normal(0, 0.01, (504, 100))
sr = lambda x: np.sqrt(252) * x.mean(0) / x.std(0, ddof=1)
k = int(np.argmax(sr(ins)))
print("reported (in-sample) Sharpe:", round(float(sr(ins)[k]), 2))     # Wrong: about 1.5–2.2
print("same strategy, holdout:", round(float(sr(outs[:, [k]])[0]), 2))  # Fix: only holdout is evidence
This book’s run prints 1.92 and 0.83. The sampling standard deviation of a single holdout Sharpe is about
12.4 Treating Overlapping Labels as Independent Observations
Error: compute a 5-day forward return every day and use
import numpy as np
rng = np.random.default_rng(1)
u = rng.normal(0.0005, 0.01, 1005)
y = np.convolve(u, np.ones(5), mode="valid")[:1000]          # 1000 overlapping 5-day labels
naive_se = y.std(ddof=1) / np.sqrt(len(y))
nonoverlap = y[::5]
honest_se = nonoverlap.std(ddof=1) / np.sqrt(len(nonoverlap))
print(round(honest_se / naive_se, 2))                        # about 2.2, close to sqrt(5)
When the covariance in this construction is known, use the exact mean-variance formula in Section 6.4. Chapter 23’s ic_summary(nw_lags=h-1) is an established Bartlett-kernel diagnostic; a fixed
12.5 Five Types of Data Leakage
| Type | Erroneous implementation | Fix |
|---|---|---|
| Target leakage | “Past 5-day return” feature is mistakenly computed with shift(-5) and is actually the future 5-day return |
Register available_at for each feature and assert available_at ≤ the exact decision cutoff (the difference between date and time is covered in Chapter 38) |
| Look-ahead feature | Use the fiscal period-end date as the availability time for a quarterly financial statement | Use the announcement/database-ingestion time (point-in-time data in Chapters 3 and 12) |
| Preprocessing leakage | Standardize the full sample, then split into training and test sets | Fit the scaler only on training rows (the Chapter 38 pipeline) |
| Selection leakage | Inspect test results, change features, and test again | Use the test only once; for a revised design, use a new holdout and record it in the trial ledger |
| Overlap leakage | Randomly shuffle into K folds when training-label intervals cover test-label intervals | Split by date and exclude training rows according to actual label intervals (Chapters 31 and 38) |
Chapter 38 gives runnable counterexamples and numerical differences for preprocessing leakage and random K-fold splitting.
12.6 No Baseline
Error: report “out-of-sample
13. Applying This to Quant Research
Turn this chapter into an evaluation protocol and apply it in Chapters 38–40 and Project 6.
Hypothesis. Write a falsifiable statement, for example: “The set of features
Design (freeze before looking at results). Specify the asset universe, sample period, frequency, signal time / trade time, label interval, feature list, model families and hyperparameter grid, training window, rebalancing frequency, cost assumptions, evaluation metrics, and pass thresholds. Record which results were seen before freezing (Chapter 22’s TrialLedger).
Check all five together.
- Out-of-sample: use date-based walk-forward evaluation; report prediction metrics (IC and
relative to both 0 and the training mean) separately from portfolio metrics (after-cost return and Sharpe). - Stability: report IC and returns by fold and year; check whether coefficients or feature importance keep the same sign across folds and whether the relationship reverses around regime shifts.
- Costs: use at least two cost levels; report turnover and the difference between before- and after-cost results.
- Tails: report maximum drawdown, the worst 1% of days, and directional accuracy on large-move days.
- Economic logic: explain why the signal should work and who bears the cost of the return; without an answer, even a strong result remains a candidate.
Baselines. Zero prediction (no position), training mean (the same prediction for every asset in a cross section, yielding a flat ranking portfolio), and one simple rule. A candidate model must outperform a baseline on the same test period and under the same costs to move to the next step.
Falsification conditions (any one means the hypothesis is not supported). After-cost net returns are not positive;
Null and negative results. Preserve and report them. In the constructed experiments in Chapter 39 and Project 6, some models lose to a zero-position baseline after costs; those results belong in the report just as much as the positive ones.
14. Chapter Summary
Accuracy,
15. Exercises
37-E01 (Hand Calculation: Accuracy and Net Returns)
Daily returns (%) are
37-E02 (Turnover)
Prove that with
37-E03 (Regime Shift)
In the model from Section 6.6, suppose the perfect Regime 1 estimate
37-E04 (Signal-to-Noise Ratio)
For
37-E05 (Overlapping Labels)
For overlapping labels with
37-E06 (Multiple Testing)
There are
37-E07 (Leakage Classification)
Classify each case as a type of leakage and give a fix: (a) impute missing feature values with the full-sample feature median; (b) use test-period IC to decide which five features to keep; (c) use a post hoc revised database version for the “analyst forecast revision” feature; (d) evaluate a model with 20-day return labels using random 10-fold cross-validation.
37-E08 (How This Differs from Competitions)
List three differences between financial prediction and a typical machine-learning competition in data generation or evaluation, and explain which common practice each difference can invalidate.
37-E09 (Baselines)
For a model on a test period,
37-T01 (New: From Score to Three Tables)
A researcher reports 55% accuracy but does not specify data-ingestion, execution, or cost timing. Write one field that must be supplied for each of the information, prediction, and ledger tables, and explain whether the next-open example in this chapter and the next-close examples in Chapters 38–39 can directly share a label.
16. Programming Exercises
37-P01 (Decision Ledger)
Implement decision_ledger(returns, positions, cost_per_unit) to return daily turnover, net returns, and ValueError; (5) raise an error if any day’s net return is
37-P02 (Effective Sample Size)
Write a function that takes
37-P03 (Selection Bias)
Simulate
17. Challenge Problems
37-C01 (The Window-Length Trade-Off)
In the model in Section 6.6, the true slope changes from
37-C02 (Design an Evaluation Protocol)
Write a one-page evaluation protocol for a study that “uses 20 closing-price features to predict cross-sectional returns over the next 5 days.” Cover the five checks in Section 13, three baselines, what will be frozen, and falsification conditions. Open-ended; see Section 18 for the rubric.
18. Solutions / Solution Hints
37-E01
The total absolute return is
37-E02
The initial position on Day 1 has turnover 1. On each subsequent day, the position reverses with probability
37-E03
For
37-E04
37-E05
37-E06
37-E07
(a) Preprocessing leakage: calculate the median on training rows only, or use the cross-sectional median on each date if only that date’s data are available. (b) Selection leakage: select features within training data (inner validation) and evaluate on the test set only once. (c) Look-ahead feature: use the point-in-time version and filter by data-ingestion time. (d) Overlap leakage: 20-day labels overlap across random folds; switch to date-based walk-forward evaluation and exclude rows according to their actual label intervals.
37-E08
Reference answers (any three, with the invalidated practice matched to each): (1) Distribution shift: a simplified competition is approximately identically distributed, while time drift in finance means random splitting may put future regimes into training; diagnose using the actual information structure. (2) The test set can be used only once: some competitions allow repeated public-leaderboard submissions, but repeatedly inspecting a financial test period creates selection leakage. (3) The objective differs: a competition metric is the objective, while the financial objective is risk-adjusted return after costs, so high accuracy can lose money. (4) Trading affects prices: a competition prediction does not change the answer, while trading size affects costs and capacity. Scoring: 1 point for each difference and 1 point for its corresponding invalidated practice.
37-E09
Relative to zero:
37-P01 Reference Implementation and Tests
The reference implementation is decision_ledger in code/ch37_ml_philosophy.py; tests are in tests/test_ch37_philosophy.py and cover the ten-day values, number of wealth points, the identity, non-finite inputs, and the
.venv/bin/python -m pytest tests/test_ch37_philosophy.py -q
Numerical check: A’s wealth at point 5 is 1.037269 and at the end is 1.056879; B’s ending wealth is 0.960020.
37-P02
Reference implementation: overlap_autocorrelation. The run in this book (seed 3703) has sample autocorrelations mode="valid" and were truncated to equal lengths.
37-P03
Reference implementation: max_null_sharpe. The run in this book (seed 3702) gives in-sample means 1.138, 1.814, and 2.304; formula values are 1.088, 1.773, and 2.292, with each difference below 0.06; holdout means are
37-C01 Reference Argument
(1) The window contains
37-C02 Scoring Rubric
10 points total: one point for each of the five checks (with a concrete metric, such as “Newey–West
37-T01 Full Answer
The information table could add feature available_at, label label_available_at, fit_time, or the exact signal cutoff, and check that the information was readable then. The prediction table could add signal date, asset, prediction, or evaluation-date set. The ledger could add trade_time, position, turnover, or cost. Any one field for each table is sufficient if its role is explained. A 55% accuracy figure does not specify these contracts and cannot imply net returns. Next-open and next-close use different return starting points, so they cannot share a label without redefining it; Chapter 38 separates exact timestamps from date indices.
19. Further Reading
- Must Know: Chapter 22 (research plans and multiple testing), Chapter 32 (DSR and HAC), and Chapter 31 (label intervals, purging, and walk-forward evaluation). Use these for the tools in Sections 6.4–6.5.
- Must Know: scikit-learn, “Common pitfalls and recommended practices” (
SK_PITFALLS), especially the sections on data leakage and preprocessing within training data. Use this as a software-side counterpart to the leakage classification in Section 12.5. - Should Know: Bailey, Borwein, López de Prado, and Zhu (2017) on the probability of backtest overfitting (
PBO). Use this to extend the selection-bias discussion in Section 6.5 to portfolio-level overfitting probability. - Should Know: the machine-learning asset-pricing and backtesting-protocol literature listed in Section 20; read the definitions of out-of-sample
and the portfolio-evaluation sections. - Optional: Chapters 35 and 36 for a review of turnover costs and execution.
20. References
SK_PITFALLS: scikit-learn, “Common pitfalls and recommended practices.” Supports the definition of preprocessing leakage in Section 5 and the repair in Section 12.5.PBO: Bailey, D. H., Borwein, J., López de Prado, M., and Zhu, Q. J. (2017). “The probability of backtest overfitting.” Journal of Computational Finance. Background for selection bias in Section 6.5.DSR: Bailey, D. H. and López de Prado, M. (2014). “The Deflated Sharpe Ratio.” Supports the approximation forin Section 6.5 (implemented by Chapter 32’s expected_max_standard_normal).CH22_HLZ2014: Harvey, Liu, and Zhu. “…and the Cross-Section of Expected Returns.” Background on multiple testing in factor research for Section 5.CH37_GKX2020: Gu, S., Kelly, B., and Xiu, D. (2020). “Empirical Asset Pricing via Machine Learning.” Review of Financial Studies 33(5), 2223–2273. Author’s close reading: Section 1.8, Equation (19), p. 2249 (relative to zero prediction and the rationale); Table 1, p. 2250 (OLS , OLS-3 0.16%, ENet+H 0.11%); Section 2.2 (NN3 0.40%); and the introduction’s long-short portfolio Sharpe ratios 1.35/2.45. Supports the baseline definition for in Section 5 and the evidence limits in Section 11. CH37_CT2008: Campbell, J. Y. and Thompson, S. B. (2008). “Predicting Excess Stock Returns Out of Sample: Can Anything Beat the Historical Average?” Review of Financial Studies 21(4), 1509–1531; the author read the NBER w11468 version, Equation (1), p. 5. Supports the historical-mean baseline definition in Section 5.CH37_AHM2019: Arnott, R., Harvey, C. R., and Markowitz, H. (2019). “A Backtesting Protocol in the Era of Machine Learning.” Journal of Financial Data Science 1(1), 64–74. A source reconnaissance report had read the full text (introduction and transaction-cost section); the author did not reopen it, so it is listed only as further reading for the evaluation protocol in Section 13.- The full academic definitions of leakage (Kaufman et al., 2012) and the paper on “accuracy versus economic returns” (Leung et al., 2021) could not be accessed; this chapter does not cite their specific conclusions. The relevant material is supported by the derivation in Section 6.1 and
SK_PITFALLS. Seecourse/zh/chapters/ch37/source_notes.mdfor the author’s reading record.