CHAPTER 20/ 45
Modern Portfolio Theory
Portfolio risk depends on weights and covariance. A mean–variance frontier is an exact mathematical object conditional on its input moments; estimated moments give an in-sample frontier. Prerequisites: Chapter 5 for matrices and definiteness, Chapter 9 for Lagrange multipliers and convex quadratic programming, Chapter 11 for simple/excess returns, Chapter 14 for CML/SML, and Chapter 15 for covariance and factor risk. You will derive portfolio variance, calculate two-asset portfolios, derive the GMV and target-return frontier, check tangency conditions, and distinguish population from estimated moments.
1. Learning goals
- State portfolio mean and variance for
assets, including the dimensions, units, interval, and timing of . - Explain how correlation changes a two-asset risk–return curve and find the threshold for a long-only portfolio to reduce risk below the least volatile asset.
- Derive the global minimum variance (GMV) portfolio, exact-target minimum-variance portfolio, and frontier hyperbola with Lagrange multipliers; identify its inefficient branch.
- Derive the tangency portfolio and optimal capital allocation line (CAL) under a single-period model with equal borrowing/lending rates; check the positive normalization denominator.
- Interpret two historical French 10-industry estimated frontiers and extreme weights as in-sample descriptions.
Check the hand calculations against Section 9, retain complete solutions in Section 18, and identify axes, units, and samples in each figure. The inherited 13 core questions, two C10 bridge questions, and new 20-B01 all retain answers.
2. Why a quant needs portfolio theory
Chapter 11 measures single-asset returns and volatility; Chapter 14 discusses CAPM pricing of systematic risk. Allocating across assets raises three questions:
- Mean return is a weighted average of asset means.
- Risk is not a weighted average of asset volatilities. Assets with volatilities 15% and 25% can give an equal-weight volatility of 5% or 20%, depending on joint movement.
- Which weights deserve consideration under a risk budget, and which are dominated regardless of preference?
Modern portfolio theory (MPT) uses covariance to calculate risk and constrained optimization to select candidates. In the lifecycle, it follows signals/forecasts and precedes execution: upstream estimates of expected return and risk inform target weights.
Using weighted-average volatility misrepresents diversification. Calling the optimizer's output “the answer” ignores dependence on input moments. Chapter 21 and Project 3 handle estimation and implementation; here we develop the exact mathematics.
3. Intuition: correlation determines how much risk can offset
Take constructed annualized means 6%/10% and volatilities 15%/25%. Allocate
Calculate an ordinary portfolio first. Set
The first two contributions come from each asset's own variance; the third from joint movement. Two cross-products appear when expanding the square. Mean is 8% and volatility 15.81%, rather than the weighted-average 20%. A variance of 0.025 is not volatility 2.5%. Covariance has squared-return units,
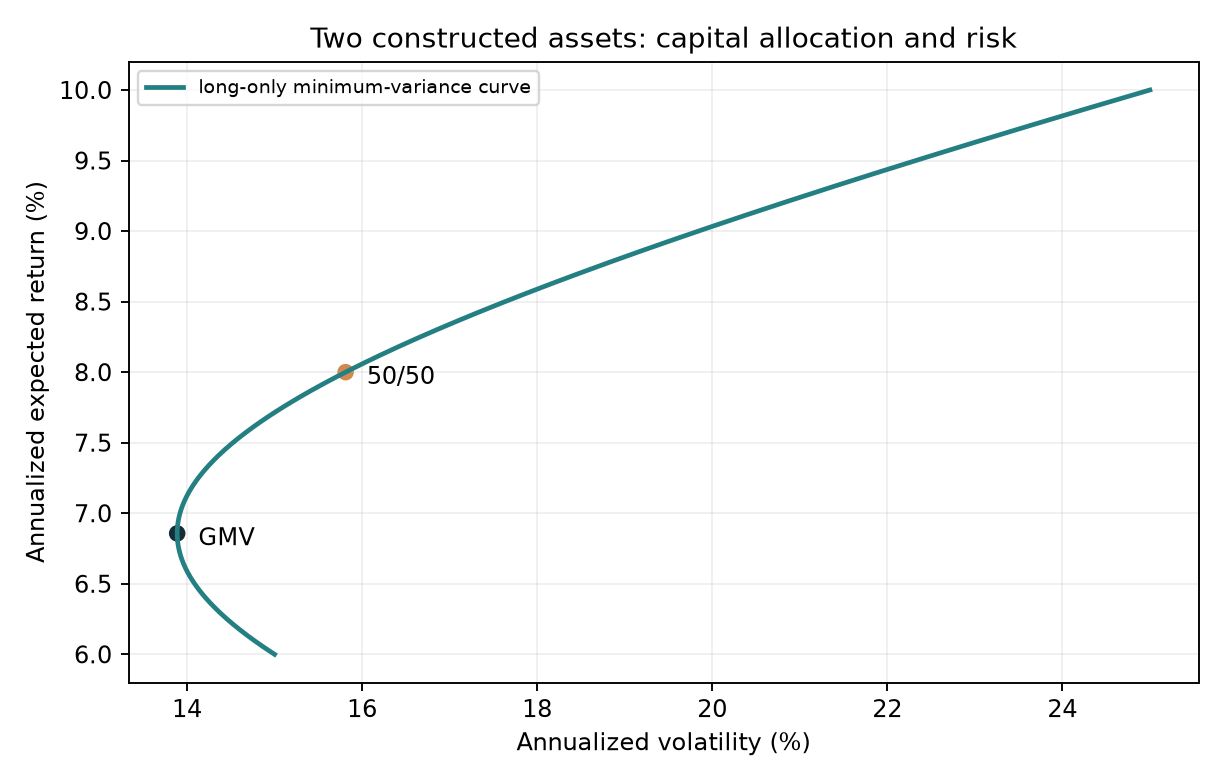
The horizontal axis is annualized volatility (%) and the vertical axis annualized expected return (%). This constructed curve restricts weights to 0–1. Locate the 50/50 point and the leftmost GMV. Points below the GMV mean have higher-return counterparts at equal risk. Section 8 calculates GMV and the 8% target. Optimality is conditional on the stated moments.
Change only correlation:
| Correlation | Lowest long-only volatility, |
Interpretation |
|---|---|---|
| +1.0 | 15.00%, all asset 1 | Joint movements leave no offset in the long-only set |
| +0.5 | 14.90% | A small offset |
| 0.0 | 12.86% | Uncorrelated components reduce variance |
| −0.5 | 9.28% | Opposing movements allow more offset |
| −1.0 | 0.00% | A riskless combination within this pair |
The chapter CLI calculated these teaching numbers. Correlation below 1 is not sufficient to reduce long-only risk below the safer asset. At 0.5, improvement is small; above
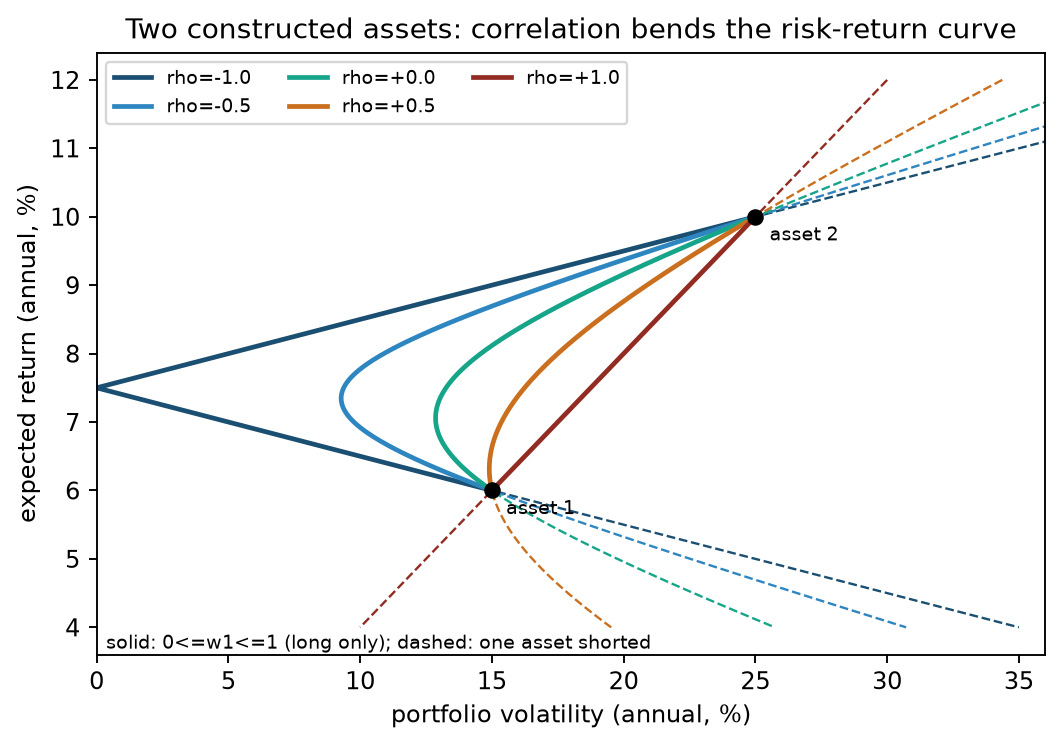
The axes show annualized portfolio volatility and mean (%). Only
Correlation measures linear co-movement over the specified horizon. It does not give the probability of joint tail crashes or ensure stability next period.
4. Mathematical foundations and notation
Use a single holding period
: number of risky assets. : simple returns in decimals; means 2%. : invested amount divided by starting NAV; a negative weight means a short position, with proceeds accounted for elsewhere. : ones. allocates the full budget to risky assets. : expected decimal returns per period. : entries , in squared-return units; diagonals are variances. : a deterministic risk-free return for the same currency and period.
A covariance matrix is symmetric and positive semidefinite (PSD):
4.1 A valid covariance can still be singular
Construct
Eigenvalues 0.08 and 0 make it PSD but not PD. Every budget-one vector
Measure both legs against the same reference capital. The 0.04 below is deterministic PnL per unit of that reference, not return divided by zero net investment. The zero-budget direction
If both assets instead have identical returns, the same covariance remains singular, but the zero-budget direction returns 0. Singularity alone therefore does not establish arbitrage. Check means and the feasible set too.
5. Definitions
Covariance and portfolio variance:
Section 6.1 derives the expression.
Diversification: variance reduction, at a fixed budget, from assets that do not move together perfectly. It does not mean an increase in return.
Feasible set and minimum-variance frontier: minimize variance for each target mean
GMV: the minimum-variance portfolio under the budget constraint alone, at the frontier's leftmost point.
Efficient frontier: the segment with mean at least the GMV mean. The lower branch is inefficient because the upper branch offers a higher mean at the same volatility.
Sharpe ratio:
Risky and risk-free assets: the ideal model allows unlimited borrowing and lending at the same
Tangency portfolio: the budget-one risky portfolio maximizing Sharpe with positive excess mean, when it exists. Its line to
Population versus estimated moments:
6. Derivations
6.1 From a double sum to a quadratic form
Start with the variance definition,
Substitute
Beginning weights are constants. Linearity of expectation, with finite second moments, gives
There are
Weights have no units and covariance has squared-return units, so variance has squared-return units.
For two assets,
Only the cross-term contains correlation. It explains the change in curvature.
Equal weighting and asset count. For
At
6.2 Two-asset minimum variance and the correlation threshold
Set
Setting this to zero and collecting
The denominator is
Assume
The numerator is positive because
6.3 GMV via Lagrange multipliers
Solve
The factor
- Symmetry gives
. - The first-order condition is
. Marginal variance contributions are equal. Moving capital toward a lower contribution would otherwise reduce variance. - PD covariance permits
. - The budget gives
, with , since the inverse is also PD. - Hence
The objective is strictly convex and the constraint affine, so the feasible stationary point is the unique global minimum. Scaling covariance by any positive
The implementation global_minimum_variance_weights solves
6.4 Exact target return and the frontier hyperbola
Add target mean
With
Define
Substitute into both constraints:
This two-by-two system has determinant
In the inner product
Simplify variance using the first-order condition:
Variance is quadratic in
- The upper branch
is efficient. - The lower branch
is inefficient. Reflection to target gives equal risk and higher mean. The target-weight function returns either branch; check efficiency yourself.
Two-fund separation.
Two assets. With
6.5 Cash, tangency, and the CAL
Risky weights need not sum to one. Cash
Then
Symmetry gives the quadratic gradient; the constraint gradient is
PD inverse gives
Call it the capital market line (CML) only with Chapter 14's CAPM equilibrium, market clearing, and the market portfolio as tangency fund. Constructed moment inputs do not establish equilibrium, so our plots say CAL. Investors share direction
Normalize the direction to a risky-only budget-one portfolio:
A positive denominator requires tangency_weights rejects nonpositive denominators.
Direct Sharpe maximization gives the same direction. For
positive scaling leaves the ratio unchanged (degree-zero homogeneity). Its stationary condition is
so
List the ideal assumptions: one period, unlimited equal-rate borrowing/lending, no costs/taxes/margin/shorting restrictions, common moments across investors, and divisible assets. If borrowing costs more than lending earns, the two rates generally give different tangencies. Between them, an investor may follow a segment of the risky efficient frontier, with lending/borrowing lines outside. Do not draw two lines joined at a presumed common tangency. Different investors may hold different risky funds.
6.6 Long-only KKT and why clipping is not optimization
Adding
Positive holdings have
Setting negative unrestricted GMV weights to zero and rescaling typically violates these conditions. Removing shorts changes hedges and leaves unequal marginal variances among the surviving assets. In Section 11, the 2000–2009 clipped portfolio has monthly volatility 3.42% versus 3.34% for the constrained QP. The CLI uses Chapter 9's solve_mean_variance for the long-only frontier.
7. Financial interpretation
Covariance determines marginal portfolio variance. Asset
The frontier does not choose a point for you. It excludes dominated portfolios. Risk aversion or a risk budget chooses among efficient points, as in Chapter 9's utility
Sharpe has a scope. It reduces mean and volatility to one number and suits portfolios that can be scaled with risk-free borrowing/lending. A higher-Sharpe fund then offers a higher mean at any volatility. Leverage limits, heavy tails, and skewness require additional drawdown/tail measures (Chapters 32–33).
Means choose direction; covariance determines hedging.
Implementation matters. Known population moments and unlimited cost-free financing/shorting are idealizations. Financing spreads, borrowing fees, margin, turnover costs, and estimation error affect the apparent Sharpe. Chapter 21 addresses them.
8. Numerical example: two assets
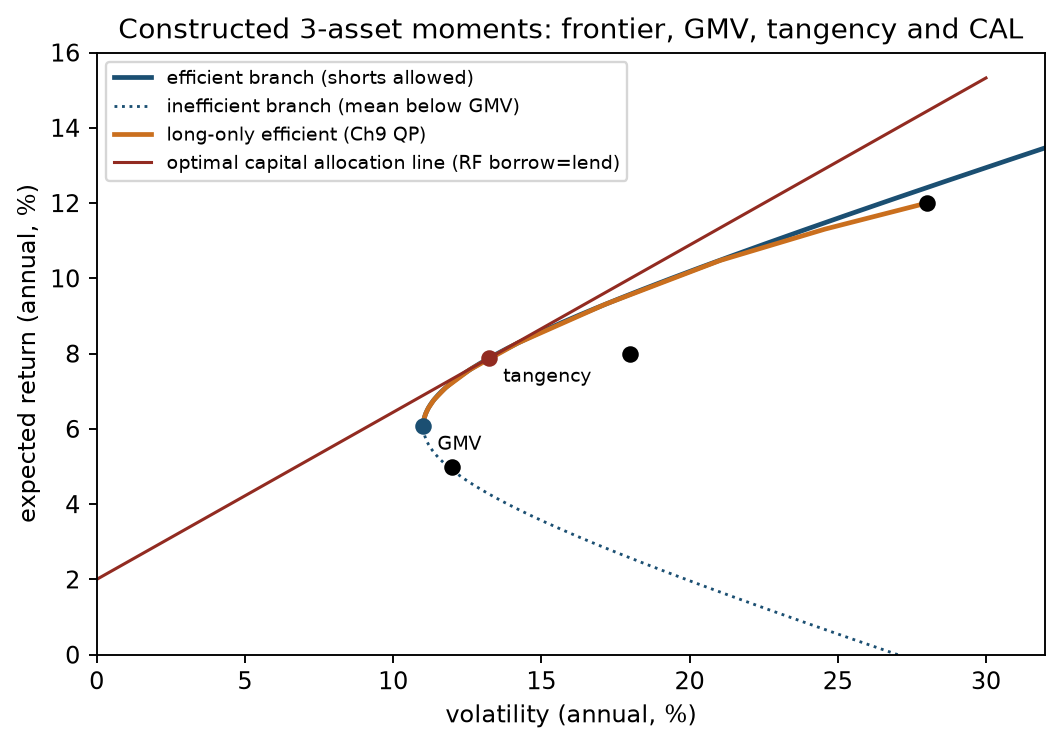
The three-asset constructed inputs are annualized means 5%/8%/12%, volatilities 12%/18%/28%, correlations 0.3/0.1/0.4, and
9. Python implementation
Default accepted-reader entry point
From the shared I3 reader root, after README.md setup, run:
.venv/bin/python run_notebook.py notebooks/ch20_portfolio_theory.ipynb
The constructed notebook does not read omitted French inputs or download data. Each run writes a fresh runs/ directory. Historical CLI/test/data paths below refer to the course root. The French route requires authorized local data and manifests and was skipped in this batch. The portable I3 CLI defaults to a new UUID run and rejects overwriting. Stay at the reader root for its commands. See README.md and OPTIONAL_DATA.md; a constructed notebook check does not rerun historical market calculations.
src/quant_course/portfolio_theory.py supplies:
portfolio_moments: mean, variance, volatility for given weights;global_minimum_variance_weights: budget-constrained GMV;minimum_variance_target_weights: exact-target frontier;tangency_weights: positive-denominator tangency fund.
Weight functions impose a budget but permit shorts/leverage and solve linear systems. Moment calculations reject nonsymmetric/non-PSD matrices; inverse-based weights additionally require numerical PD, and target weights require unequal means. Moment evaluation accepts singular PSD input. Long-only frontiers reuse src/quant_course/optimization_tools.py and Chapter 9's solve_mean_variance.
code/ch20_portfolio_theory.py recalculates Section 8, draws figures, and provides an optional descriptive French route. It reads local files, checks manifest SHA-256, and does not download. The portable default output is a fresh UUID's results/figures directories; specify fresh targets for the optional historical route:
.venv/bin/python code/ch20_portfolio_theory.py --output-dir /tmp/ch20-out --figure-dir /tmp/ch20-fig
notebooks/ch20_portfolio_theory.ipynb calls the shared functions and asserts results. Historical tests are tests/test_ch20_portfolio_theory.py and tests/test_ch20_workflow.py; they are not bundled as original tests in the reader. Use the course source and its evidence records for these paths.
The block below recalculates Section 8 in annualized decimals:
import numpy as np
from quant_course.portfolio_theory import (
    global_minimum_variance_weights, minimum_variance_target_weights,
    portfolio_moments, tangency_weights,
)

mu = np.array([0.06, 0.10])
cov = np.array([[0.0225, 0.0075], [0.0075, 0.0625]])
rf = 0.02

gmv = global_minimum_variance_weights(cov)
assert np.allclose(gmv, [11 / 14, 3 / 14])
m = portfolio_moments(gmv, mu, cov)
assert np.isclose(m.expected_return, 0.068571428571) and np.isclose(m.variance, 0.019285714286)

ones = np.ones(2)
A = ones @ np.linalg.solve(cov, ones)
B = ones @ np.linalg.solve(cov, mu)
C = mu @ np.linalg.solve(cov, mu)
D = A * C - B ** 2
assert np.isclose(B / A, m.expected_return) and np.isclose(1 / A, m.variance)

target = minimum_variance_target_weights(mu, cov, target_return=0.08)
assert np.allclose(target, [0.5, 0.5])
assert np.isclose(target @ cov @ target, (A * 0.08 ** 2 - 2 * B * 0.08 + C) / D)

tangent = tangency_weights(mu, cov, risk_free_return=rf)
assert np.allclose(tangent, [19 / 34, 15 / 34])
t = portfolio_moments(tangent, mu, cov)
sharpe = (t.expected_return - rf) / t.volatility
assert np.isclose(sharpe ** 2, C - 2 * rf * B + rf ** 2 * A)
print(round(sharpe, 5))  # 0.38103
The constructed model sets beginning weights for one common interval. French month labels denote calendar-month returns. Each window's moments use all 120 months, with no signal or fill time: these are historical descriptions. The loader rejects missing/duplicate months and nonfinite values instead of dropping rows.
10. Visualization
Read the correlation plot beside Section 3 and the three-asset/cash plot beside Section 8. The next plot shows historical changes in estimated moments.
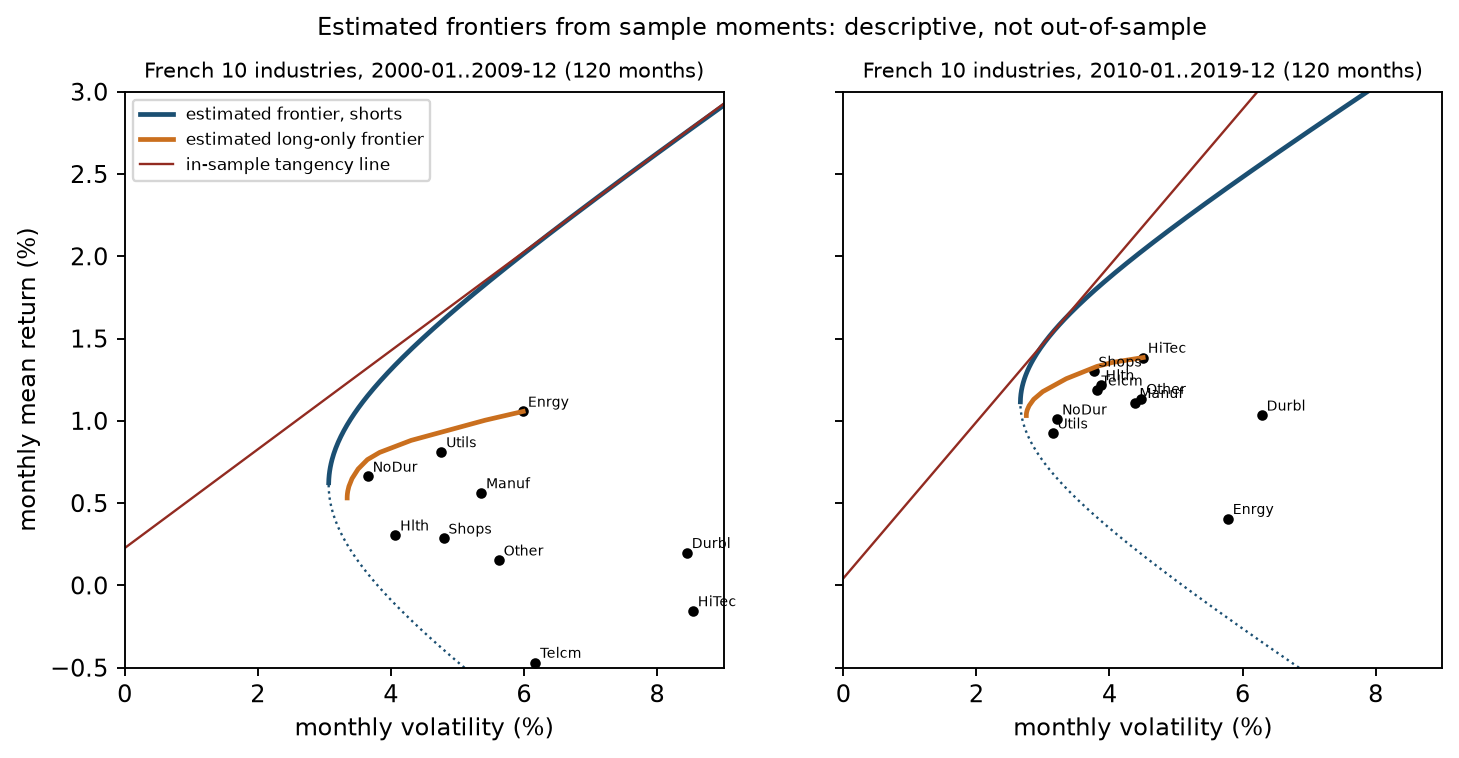
Axes are monthly volatility (%) and monthly mean (%). Panels use 2000-01–2009-12 and 2010-01–2019-12,120 months each. Black dots are the 10 industries, navy the estimated unrestricted frontier, orange long-only, and red the in-sample tangency line. Industry locations change across windows: HiTec has negative mean in the first and the highest in the second. The first tangency lies beyond the plot, with monthly volatility above 9% and gross exposure about 5.8. These plots describe what follows if sample moments equal population moments. They do not forecast the next window.
11. Real market example: estimated French 10-industry frontiers
The historical source is Kenneth R. French's value-weighted monthly total returns for 10 Industry Portfolios and RF from the FF3 file, downloaded and frozen 2026-10-05. The full source sample spans 1926-07–2026-08,1,202 months. Processed industry CSV SHA-256 is 3b097d810c295d64eedfa1ece7067ff2a0707f5ca90e33935df9949251f70950. src/quant_course/french_frozen.py checks six raw/extracted/processed files against manifests. These are currently revised historical data without historical vintages or reception logs; they are not PIT data. Industry research portfolios are not tradable products with execution records. Raw data are omitted from the portable reader.
For each window, historical calculations used sample means, covariance with divisor
| Window | Mean RF | GMV vol | Long-only min vol | 1/N vol | In-sample tangency Sharpe | Tangency gross exposure | Covariance condition number |
|---|---|---|---|---|---|---|---|
| 2000-01–2009-12 | 0.227% | 3.07% | 3.34% | 4.45% | 0.300 | 5.84 | 86.8 |
| 2010-01–2019-12 | 0.043% | 2.66% | 2.75% | 3.58% | 0.475 | 2.80 | 101.1 |
Weights in percent:
| Fund | NoDur | Durbl | Manuf | Enrgy | HiTec | Telcm | Shops | Hlth | Utils | Other |
|---|---|---|---|---|---|---|---|---|---|---|
| 2000 s GMV | 48.2 | −5.5 | −18.5 | 9.5 | 0.6 | −1.1 | 43.2 | 34.3 | 14.0 | −24.7 |
| 2000 s tangency | 159.2 | 6.4 | 29.9 | 51.3 | 24.4 | −122.9 | 51.0 | −10.8 | 19.5 | −108.2 |
| 2000 s long-only min | 40.6 | 0.0 | 0.0 | 2.4 | 0.0 | 0.0 | 13.0 | 31.0 | 13.0 | 0.0 |
| 2010 s GMV | 21.7 | −13.6 | −13.4 | −7.3 | 3.4 | 1.2 | 13.8 | 11.5 | 52.3 | 30.3 |
| 2010 s tangency | −20.0 | −26.3 | 12.6 | −43.4 | 23.4 | 28.8 | 39.2 | 7.0 | 49.0 | 29.7 |
| 2010 s long-only min | 23.4 | 0.0 | 0.0 | 0.0 | 0.0 | 0.0 | 11.1 | 15.2 | 49.7 | 0.6 |
Interpretation against theory:
- GMV and long-only minimum variance have lower in-sample volatility than 1/N in both windows:3.07%/3.34% versus 4.45%, and 2.66%/2.75% versus 3.58%. They use covariance without mean estimates. Persistence out of sample requires Project 3's design.
- Their large long holdings include low-volatility, lower-correlated industries such as NoDur, Hlth, Utils, and Shops. Held-asset marginal variances satisfy the relevant unrestricted or constrained conditions. Within a window, the constraint explains the difference between GMV and long-only minimum variance.
- Clipping and normalizing GMV gives 3.42%/2.88% volatility, above QP's 3.34%/2.75%.
- Tangency weights change sharply: NoDur +159% to −20%, Enrgy +51% to −43%. Their in-sample Sharpe exceeds each individual industry's, using the same data for estimation and evaluation.
- RF 0.227%/month exceeds the later window's 0.043%. Both lie below the corresponding GMV means 0.612%/1.109%, so both tangency denominators are positive.
These results show how fixed formulas respond to different historical windows. They do not evaluate earlier weights in the next window. That requires frozen rolling train/test rules and turnover/cost ledgers, as in Chapter 21 and Project 3. This section supplies no out-of-sample, after-cost, or tradability conclusion.
12. Common mistakes
| Error | Consequence | Correction |
|---|---|---|
| Volatility |
Ignores covariance; equality holds for perfectly correlated long holdings, while other long-only cases generally give an overestimate; shorts need separate calculation | Use |
| Correlation below 1 guarantees improvement below the safer asset | Above |
Calculate the threshold |
| Calling the whole frontier efficient | Includes dominated lower-branch portfolios | Restrict to |
| Monthly mean/covariance with annual |
Wrong excess mean/direction; denominator can change sign | Match periods |
| Clipped GMV called long-only optimal | Violates KKT;3.42% versus QP 3.34% | Solve constrained QP, check status/residuals |
| Normalize at |
Negative excess mean or zero denominator | Check |
| Passing small monthly covariance directly to a solver | Historical CLARABEL output said optimal but exceeded the core's |
In a zero-mean problem scale covariance by its largest absolute entry; still check status and residuals |
| Present in-sample Sharpe 0.475 as attainable strategy Sharpe | Reuses estimation data for evaluation | Evaluate rolling out-of-sample, after costs |
Runnable comparison:
import numpy as np
from quant_course.portfolio_theory import global_minimum_variance_weights, tangency_weights

cov = np.array([[0.0225, 0.0075], [0.0075, 0.0625]])
w = np.array([0.5, 0.5])
wrong_vol = w @ np.sqrt(np.diag(cov))          # Weighted-average volatility
right_vol = np.sqrt(w @ cov @ w)               # Portfolio volatility
print(round(wrong_vol, 4), round(right_vol, 4))  # 0.2 0.1581

mu_monthly = np.array([0.06, 0.10]) / 12
cov_monthly = cov / 12
annual_rf = 0.02
try:  # Monthly means with annual RF: denominator turns negative
    tangency_weights(mu_monthly, cov_monthly, risk_free_return=annual_rf)
except ValueError as error:
    print("rejected:", error)
fixed = tangency_weights(mu_monthly, cov_monthly, risk_free_return=annual_rf / 12)
assert np.allclose(fixed, [19 / 34, 15 / 34])
assert np.allclose(global_minimum_variance_weights(cov_monthly), [11 / 14, 3 / 14])
13. Quant research application
A falsifiable question is whether monthly rolling estimated tangency portfolios, under frozen windows/estimators/constraints, improve after-cost out-of-sample Sharpe over equal weight and minimum variance, which do not estimate means.
- Record source, version, return definition, sample, missing-data rules, and hashes. Revised French industry data support bounded descriptive research without historical vintages.
- At month
end, estimate moments over , set weights, and hold month . Add a month's information lag as sensitivity if publication delay is relevant. - Freeze window length, covariance estimator, caps, cost rate, and fallback before evaluating. Do not tune on the out-of-sample period.
- Separate drifted pretrade weights, turnover, costs, gross return, and net return.
- Compare 1/N and minimum variance, plus ERC as a risk-contribution benchmark. Objectives, inputs, and feasible sets differ, so return differences do not isolate a causal contribution from mean estimation.
- Report uncertainty intervals for return and Sharpe differences, for example paired block bootstrap; retain negative and zero results.
- Lack of improvement after costs, or improvement restricted to isolated parameter settings, does not support usefulness.
13.1 From moments to capital: four interfaces
With NAV 1,000,000, a 10% target means 100,000 currency units. A fully invested risky portfolio satisfies
Project 3's frozen monthly ten-industry specification uses:
| Strategy | Objective/input rationale | Feasible set and fallback |
|---|---|---|
| Equal weight (EW) | 10% each, no moment estimation; tests whether estimation/optimization adds value | Long-only, fully invested; predefined optimization fallback |
| Minimum variance (MinVar) | Minimize |
Long-only, full investment,40% per-asset cap; log failure and fall back to EW |
| Maximum Sharpe (MaxSharpe) | Training-window excess mean divided by predicted volatility; estimates both moments | Same 40% cap; no positive-excess feasible portfolio or solver failure triggers EW |
| Equal risk contribution (ERC) | Covariance only;10% volatility-contribution share per asset | Positive weights, full investment, no 40% cap; log Newton failure and use EW |
The shared MinVar/MaxSharpe cap aids their comparison; ERC has a wider feasible set. Observed ERC weights below 40% do not establish a guaranteed cap. Strategy differences mix objectives, estimates, and constraints. Report net mean, Sharpe, volatility, drawdown, turnover, and concentration. Minimum variance need not maximize return; equal risk shares need not improve net Sharpe. Chapter 21 separates descriptions from difference intervals.
13.2 Two information clocks, one execution time
Month
| Specification | W-month training interval | Decision/virtual fill | Holding interval |
|---|---|---|---|
| Frozen Project 3 lag 0 | End of |
End of |
|
| Teaching lag 1/project sensitivity | Still end of |
Same holding month |
For January 1990 with
20-C02 adopts lag 1 as a conservative teaching convention. Project 3 retains idealized lag 0 at the month boundary and checks lag 1 sensitivity. A currently revised French snapshot has no contemporaneous publication versions or fill logs. Lag 1 changes the window; it does not prove historical arrival or tradability. It supports comparisons under a limited rolling specification, with historical availability and execution requiring separate evidence.
14. Chapter map
Covariance connects asset risks through
Check input horizons and units, select the objective/feasible set, and treat estimated frontiers as in-sample relationships. Use out-of-sample and after-cost evidence to assess a portfolio decision (Chapter 21/Project 3).
15. Exercises
Full solutions follow in Section 18.
20-E01 (dimensions): For 10 monthly assets, give dimensions/units of
20-E02 (variance expansion):
20-E03 (two-asset GMV): Volatilities 0.20/0.30 and correlation 0.5. Calculate GMV weights, variance, volatility, and long-only feasibility.
20-E04 (threshold): Prove that with
20-E05 (limit): Equal-weight
20-E06 (lower branch): Use Section 8 constants for target 5%. Find weights/variance and a higher-mean frontier portfolio at the same risk.
20-E07 (tangency): For Section 8 assets with
20-E08 (estimation): Under IID, a monthly volatility 4.5% and 120 observations give what mean standard error? Compare it with industry monthly mean differences 0.1%–0.5% and explain changing tangency weights.
20-B01 (singularity and mean): For Section 4.1, calculate mean/variance for any budget-one weights, the minimum-variance solution set, and zero-budget direction's return. If both means become 6%, does singularity still establish arbitrage?
16. Programming exercises
20-P01: Write frontier_constants(mu, cov) returning
20-P02: With the authorized frozen French source for 2010-01–2019-12, calculate unrestricted GMV, clipped/normalized GMV, and Chapter 9 long-only QP. Assert QP volatility no greater than clipped volatility and report both monthly values.
20-P03: Prove invariance of GMV/target weights when mean×100, covariance×10000, target×100. Construct monthly moments with annual
17. Challenge problems
20-C01: Prove
20-C02: Design a test of rolling estimated tangency after-cost superiority to 1/N. Specify data, timing, windows, estimators, constraints, failure/fallback, cost ledger, inference, and falsification. Explain why in-sample Sharpe cannot establish it.
C10 bridge questions, with separate stable IDs
20-R01: For fully invested ten-industry EW/MinVar/MaxSharpe/ERC, identify moments and which methods carry a 40% cap. Why does slightly higher ERC net Sharpe not isolate an algorithm advantage under common constraints? At NAV 1,000,000, give EW amounts.
20-R02: January 1990 holding month,
18. Solutions / Solution Hints
20-E01
20-E02
Covariances are
20-E03
Variance
20-E04
Section 6.2 gives
20-E05
20-E06
with full-precision constants, volatility 18.54%. Direct expansion
20-E07
20-E08
IID standard error
20-B01
For
20-P01
import numpy as np
from quant_course.portfolio_theory import global_minimum_variance_weights, minimum_variance_target_weights

def frontier_constants(mu, cov):
    ones = np.ones(len(mu))
    inv_one, inv_mu = np.linalg.solve(cov, ones), np.linalg.solve(cov, mu)
    A, B, C = ones @ inv_one, ones @ inv_mu, mu @ inv_mu
    return A, B, C, A * C - B ** 2

sigma = np.array([0.12, 0.18, 0.28])
corr = np.array([[1, 0.3, 0.1], [0.3, 1, 0.4], [0.1, 0.4, 1]])
cov = np.outer(sigma, sigma) * corr
mu = np.array([0.05, 0.08, 0.12])
A, B, C, D = frontier_constants(mu, cov)
for m in (0.04, 0.07, 0.11):
    w = minimum_variance_target_weights(mu, cov, target_return=m)
    assert np.isclose(w @ cov @ w, (A * m * m - 2 * B * m + C) / D)
g = global_minimum_variance_weights(cov)
assert np.isclose(g @ mu, B / A) and np.isclose(g @ cov @ g, 1 / A)
print(np.round([B / A, np.sqrt(1 / A)], 4))  # [0.0607 0.1102]
The assertions check each exact-target variance, GMV mean, and GMV variance using shared implementations.
20-P02
import numpy as np
from quant_course.french_frozen import load_industries_and_rf
from quant_course.optimization_tools import solve_mean_variance
from quant_course.portfolio_theory import global_minimum_variance_weights

returns, rf, _ = load_industries_and_rf()
cov = returns.loc["2010-01":"2019-12"].cov().to_numpy()
gmv = global_minimum_variance_weights(cov)
clipped = np.clip(gmv, 0, None)
clipped /= clipped.sum()
qp = solve_mean_variance(np.zeros(10), cov / np.max(np.abs(cov))).weights
vol = lambda w: float(np.sqrt(w @ cov @ w))
assert vol(gmv) <= vol(qp) <= vol(clipped)
print(round(100 * vol(clipped), 3), round(100 * vol(qp), 3))  # 2.876 2.751
QP satisfies equal marginal variance on positive holdings; clipping does not. Unrestricted GMV has the lowest volatility 2.661%, with shorts in Durbl, Manuf, and Enrgy. Historical displayed clipped/QP values are 2.876%/2.751%; this batch did not rerun the French input route.
20-P03
import numpy as np
from quant_course.portfolio_theory import (
    global_minimum_variance_weights, minimum_variance_target_weights, tangency_weights)

mu = np.array([0.06, 0.10]); cov = np.array([[0.0225, 0.0075], [0.0075, 0.0625]])
assert np.allclose(global_minimum_variance_weights(cov), global_minimum_variance_weights(cov * 10000))
assert np.allclose(minimum_variance_target_weights(mu, cov, target_return=0.08),
                   minimum_variance_target_weights(mu * 100, cov * 10000, target_return=8.0))
try:
    tangency_weights(mu / 12, cov / 12, risk_free_return=0.02)
    raise AssertionError("this example has a negative normalization denominator")
except ValueError:
    pass
assert np.allclose(tangency_weights(mu / 12, cov / 12, risk_free_return=0.02 / 12), [19 / 34, 15 / 34])
# No frequency metadata: another mismatched input can return weights.
wrong_but_accepted = tangency_weights(np.array([0.03, 0.04]), cov / 12, risk_free_return=0.02)
assert np.isfinite(wrong_but_accepted).all()
Monthly means 0.005/0.00833 are below annual
20-C01
(1) PD inverse defines
(2)
(3) Differentiate
For
Grade 2 per proof and 2 for the numerical check; subtract 1 for omitting PD or positive denominator conditions.
20-C02
A complete plan includes:
- Data: source, version, hashes, total-return/currency convention, dates, missingness and delisting. French industry snapshots permit bounded descriptive conclusions.
- Timing: estimate only with received information; account for publication lag. Project 3 uses
; this teaching lag 1 uses . Both hold month . - Prespecification:
, sample/shrinkage covariance, mean estimator, shorts/caps, fees, fallback, all before evaluation. An example fallback is EW when no positive-excess feasible portfolio exists. - Ledger: drifted pretrade weights, unhalved
, cost, gross and net returns. - Evaluation: out-of-sample net Sharpe, volatility, drawdown, turnover, concentration; compare 1/N/MinVar; paired block-bootstrap intervals for return and Sharpe differences; retain all cost/window sensitivity settings.
- Falsification: no after-cost improvement or improvement only under isolated settings does not establish superiority.
Teaching reference with an information lag. Freeze a 60-month rolling window, monthly rebalancing, long-only 40% cap, sample means and shrinkage covariance. Compare EW, MinVar, and MaxSharpe. For holding month
In-sample Sharpe reuses data for choosing and evaluating weights, allowing the optimizer to exploit estimation noise. Grade 2 each for timing/data, prespecification/fallback, ledger/cost, inference/falsification. Full-sample estimation or shuffled K-fold fails this design.
20-R01
EW estimates no moments; MinVar/ERC estimate covariance; MaxSharpe also estimates excess means. All are long-only and fully invested; only MinVar/MaxSharpe impose 40%. ERC needs positive risk budgets and PD covariance in this implementation; observed weights below 40% do not ensure a cap. Objective, estimation, and feasible set differ, so a Sharpe ranking cannot isolate an algorithm effect; also report paired difference intervals. At NAV 1,000,000, EW targets 100,000 per asset; amounts drift with returns before rebalancing.
20-R02
Lag 0 trains 1985-01–1989-12; lag 1 trains 1984-12–1989-11. Both decide and virtually fill at December 1989 end, holding through January 1990 end. Lag 1 removes the latest month and adds an earlier one, keeping 60 months. It provides a buffer without establishing contemporaneous versions, reception, tradability, constituents, or capacity. Those require separate records.
19. Further reading
- Must know: Markowitz 1952, “Portfolio Selection,” for E–V motivation, covariance/diversification, and residual common risk. Suggested reading 77–81 is broader than the recorded actual reading of 77–80's first part. The original excludes shorting; do not attribute this chapter's general
-asset closed forms to that article. - Must know: MOSEK Cookbook Chapter 2, Sections 2.1–2.2, for mean–variance formulations and budget/leverage/turnover constraints.
- Should know: Sharpe 1994 for ex ante and ex post ratios and differential returns; Boyd and Vandenberghe for QP/KKT alongside Chapter 9.
- Advanced: Stanford CVX Short Course's portfolio example for numerical trade-offs and constraints; this recommendation does not claim a new reading.
- Optional: notebook/CLI in order: load, verify hashes, estimate, optimize, plot.
20. References
- CH20_MARKOWITZ1952: Harry Markowitz, “Portfolio Selection,” Journal of Finance7(1),77–91,1952. Berkeley mirror. Historical actual reading: extracted text on 77–80's first part; later geometric pages and scanned formulas were not fully inspected. Closed-form derivations here are author calculations.
- CH20_MOSEK_COOKBOOK: Portfolio Optimization Cookbook1.6.0, Chapter 2. Historical record covers 2.1–2.2 and the start of 2.3;2.4 code was not run.
- SHARPE1994: William F. Sharpe, “The Sharpe Ratio,” Journal of Portfolio Management, Fall 1994. Author's page. Recorded reading covers differential returns, ex-ante/ex-post definitions, and aggregation without serial correlation, rather than the full fund-comparison discussion.
- BOYD: Stephen Boyd and Lieven Vandenberghe, Convex Optimization. Author's site. Inherited shared source.
- CVXPY: Documentation. The historical chapter used Chapter 9's CLARABEL path and did not add a document reading.
- FRENCH: 10 Industry Portfolios and Fama/French Factors. Historical source/manifest checks remain version-bound; no new download or empirical run occurred in BIL01.
Local shared references: source notes, accepted reader setup, optional data contract, shared script, shared notebook, Chinese Chapter 5, Chinese Chapter 9, Chinese Chapter 11, Chinese Chapter 14, Chinese Chapter 15.