CHAPTER 17/ 45
Time Series II: Unit Roots, Cointegration, and Prediction
Through line: Two series can move closely together without sharing a stable long-run relationship. Testing, forecasting, and trading are three different questions. Prerequisite: Chapter 16. After this chapter, you should be able to derive and interpret the augmented Dickey–Fuller (ADF) regression; distinguish deterministic from stochastic trends; estimate and recursively forecast a bivariate vector autoregression (VAR); interpret Granger predictive-causality tests correctly; assess cointegration using the Engle–Granger two-step test and its dedicated critical values; and design a pairs-trading study that does not leak future information.
1. Learning Objectives
After completing this chapter, readers should be able to use month-indexed series to answer four distinct questions: Does a series contain a unit root? Do two I(1) series have a stationary linear combination? Do lags of one variable improve forecasts of another? Can a statistical relationship be turned into a trading rule with explicit timestamps and measurable risk and costs? These questions are related in sequence, but none can replace another.
The calculations include deriving ADF's
2. Why Quants Need This
Chapter 16 asks whether a series' mean, variance, and autocorrelation can be described by a stable model. This chapter extends the question to financial series with similar long-run movements. A level regression between two steadily rising indexes can produce very high correlation and
The logic is sequential: first describe whether trends arise from deterministic terms or random shocks, then test for a unit root; if several variables are individually nonstationary, ask whether a stationary combination exists; use a suitable VAR and predictive test for stationary or differenced variables; only then turn the frozen model into a research design with delayed execution and measured risk and costs for each leg. A unit-root test does not establish cointegration; a cointegration test does not establish predictive causality; and a predictive relationship does not establish positive net trading returns.
3. Intuition
Imagine two industry total-return indexes that can each be pushed upward by new shocks every month. A shared market shock can make them rise and fall together over the long run. But if each also accumulates its own independent random error, their difference will keep drifting. A high correlation shows strong linear comovement within the sample; it does not show that the difference returns to a long-run level.
Another process can be written as
3.1 High Correlation in the Same Window Can Arise from Two Mechanisms
Let
Even when the population correlation at each time is high, the difference continues to accumulate independent shocks. More generally, the variance of
For the cointegrated pair, keep the same
| Cumulative difference |
Stationary deviation |
||||
|---|---|---|---|---|---|
| 0 | 0 | 0 | 0 | 0.0 | 0.0 |
| 1 | 1 | 0.1 | 1.1 | 0.2 | 2.2 |
| 2 | 3 | 0.2 | 3.2 | −0.1 | 5.9 |
| 3 | 2 | 0.3 | 2.3 | 0.1 | 4.1 |
| 4 | 4 | 0.4 | 4.4 | −0.2 | 7.8 |
| 5 | 6 | 0.5 | 6.5 | 0.0 | 12.0 |
The sample correlation in this window exceeds 0.99 for both pairs. The conceptual distinction is whether the generating mechanism continues to accumulate errors, not which of these six-point correlations is larger. The longer samples in Figure 17-1 show how finite-sample tests distinguish the two constructions.
4. Mathematical Foundations
Throughout this chapter,
For a
White noise is not automatically independent and identically distributed. Weak stationarity requires a constant mean and variance, with covariance depending only on the lag. A unit-root process is generally not weakly stationary: accumulated shocks make its variance change with sample time. Critical values also depend on the regression's deterministic terms, number of variables, sample, and null hypothesis. This chapter does not apply ordinary Student-
5. Formal Definitions
Unit root: A series has a unit root if its autoregressive lag polynomial
Deterministic trend: n), a constant (c), a constant and linear trend (ct), or a constant, linear, and quadratic trend (ctt). These options express modeling assumptions; they are not knobs for repeatedly searching for a small p-value.
Augmented Dickey–Fuller test (ADF): A univariate test for a unit root. The null is that the level contains a unit root; the alternative is rejection of the unit-root null conditional on the specified deterministic terms. Several lagged differences are added to absorb serial correlation in the differenced regression residual. The null distribution of the statistic is nonstandard, so it must be interpreted using the Dickey–Fuller/MacKinnon reference distribution for the same deterministic specification.
Vector autoregression (VAR): Each of
Granger predictive-causality test: For a specified sample, lag order, and information set, this test asks whether past values of
Order of integration and cointegration: In this chapter,
Engle–Granger two-step test: For two candidate coint implements this test.
Error-correction model (ECM): A representation that includes both short-run difference dynamics and the previous period's long-run cointegration deviation. If variables are cointegrated, it describes how subsequent changes adjust to the deviation; differencing alone loses this long-run information. This chapter discusses the form only in 17-C02 and does not fit an ECM.
Pairs trading: A family of long-short strategies that combines two asset series whose spread may be stable. Statistical cointegration is only the starting point for research. A strategy still needs an in-sample relationship estimate, frozen signal rules, separate signal and execution times, returns and risk measured for each leg, costs deducted, and out-of-sample testing.
6. Derivations
6.1 From AR(1) to the ADF Coefficient
Start with the AR(1) from Chapter 16:
This step turns “does the level have a unit root?” into “does the level provide mean-reverting information about next period's change?” The unit-root null
In the ADF specification, lagged differences are included to reduce serial correlation in
Why not use an ordinary t table? Under
6.2 Trend-Stationary and Difference-Stationary Series
If
How a New Shock Enters Future Levels
In the random walk
For the trend-stationary example
6.3 Why Residual ADF Uses Different Critical Values
Suppose
Under the no-cointegration null, the long-run coefficient coint(y, x); do not pass first-stage residuals to ordinary adf_test and draw a conclusion directly from its p-value.
A Pre-specified Coefficient and a Same-Sample Residual: Which Reference Table?
| Object being tested | Source of coefficient | Null hypothesis and reference distribution |
|---|---|---|
| A pre-specified |
Unrelated to the test sample and treated as a fixed, known constant | Test this given series for a unit root; use the ordinary ADF distribution under its error and deterministic-term assumptions |
| OLS fit on the same training sample | The candidate |
|
| Residual in a new window, |
Estimated on an earlier training window and then frozen | A relationship-stability diagnostic; freezing does not remove training-parameter error or automatically justify ordinary ADF finite-sample calibration |
The first row asks whether a given combination has a unit root; the second asks whether an estimated long-run relationship is cointegrated. The questions and sampling steps differ. For the first row, the coefficients must not be chosen after looking at this sample, and an ordinary ADF result for one combination is not equivalent to a full joint cointegration study.
Deterministic terms, lag order, and training window are all part of the test design. The intercept represents a nonzero location; a linear trend represents deterministic growth. ADF lagged differences absorb short-run dependence. Too few lags may leave serial correlation in the errors; too many consume observations and test power. Fix the candidate maximum, selection criterion, and residual checks within the training window. The Engle–Granger deterministic terms belong to the first-stage long-run equation; the second-stage residual test cannot switch to an ordinary ADF specification. In a short window,
6.4 VAR and Granger Tests
For a bivariate VAR(1), let
In the
For example, an omitted release variable
6.5 From Cointegration to a Tradable Spread
Suppose the logarithms
Under a conceptual rule, if the month-end, observable
6.6 Converting a Log Coefficient into Notional and Shares
The small change in
| A-leg notional | B-leg notional | Portfolio meaning | |
|---|---|---|---|
| Long A, short B; gross exposure |
|||
| Short A, long B | |||
| Both legs long | |||
| Both legs short |
General cointegration does not require
Worked example:
Fixed initial notionals do not automatically maintain the same notional each period: prices drift while the position is held, so rebalancing is needed to restore target ratios, and rebalancing incurs costs. If
7. Financial Interpretation
A unit root means shocks in levels may continue to affect valuation or accumulated wealth, changing the relevant risk horizon, long-run behavior, and forecast uncertainty. A trend-stationary process tends to return to its trend after a shock; each shock permanently redirects the path of a stochastic-trend process. These mechanisms call for different models and hedging horizons.
Cointegration can be understood as an empirical linear error that does not diverge over time. Its source might be cash flows, a common discount rate, policy, industry structure, or index construction. Structural change, mergers or industry reclassification, and regime changes during crises can break the relationship. A Granger predictive test says only whether historical
Pairs research turns a possible long-run constraint into a signal, but “cointegration” does not mean that the spread will revert within the intended holding period. Short-term liquidity risk, borrow recalls, financing, and trading impact can cause losses before statistical reversion. A cumulative index built from monthly industry-portfolio returns is also not two stocks that an investor can directly trade. The real-data example in this chapter is descriptive and reports no strategy returns.
8. Numerical Examples: Step by Step
8.1 Hand-Calculating the ADF Coefficient
Let
Thus
8.2 Hand-Calculating the First-Stage Engle–Granger OLS
8.3 Two-Step Forecast from a Bivariate VAR
8.4 One Return Interval and Two Legs
9. Python Implementation
Default Entry Point for This Reader Edition
From the accepted I3 reader package root, create an independent environment using its environment instructions, then run:
.venv/bin/python run_notebook.py notebooks/ch17_time_series_ii.ipynb
The default run constructs two 900-month samples using seeds 20261017 and 20261018. In the noncointegrated simulation, the common-innovation standard deviation is 1 and the independent-innovation standard deviation is 0.2; this has different inputs from the hand-worked variances 9/0.25/0.25 in Section 3.1. The cointegrated construction uses beta=1.4, a spread AR coefficient of 0.65, innovation standard deviation 0.35, intercept 0.25, and a stationary initial spread. Ordinary ADF is applied to the known spread; the estimated same-window relationship receives EG-specific calibration. A separate two-variable VAR uses seed 1704 for 120 rows from 1990-01, trains on the first 100 months through 1998-04, and forecasts 1998-05 and 1998-06. Its generating coefficients are A=[[0.35,0.12],[0.05,0.30]], c=[0.25,−0.10], and innovation standard deviation 0.10. This Notebook does not run a Granger test.
The Notebook displays the existing bundled figure fixtures/figures/a4/ch17_cointegration_simulation.png; displaying it does not regenerate it. RUN_FRENCH=False disables the historical market branch. Although it creates and prints runs/ch17_time_series_ii_<uuid>/, this Notebook writes no CSV or PNG there. The runner separately saves the executed copy and status in a unique runs/execution_* directory; these directories serve different purposes. Constructed calculations are not evidence of market predictability or strategy net returns. The historical French figures and numbers in Sections 10–11 retain their original status.
The CLI and production tests below belong to the historical course working-root workflow and are not this package's default route. Readers need not restore production tests that are absent from the package. The I3 Chapter 16 CLI still reads French data unconditionally; the Chapter 17 CLI's historical branch requires --french-data. Neither replaces the default command above.
Historical Course Working Root and Original Implementation
The chapter's core is in cointegration.py. It reuses Chapter 16's validate_monthly_series and also strictly validates multicolumn monthly tables. It requires an ascending, unique, continuous PeriodIndex(freq="M") and converts numeric values to finite float64. Missing months, NaN, infinity, booleans, and complex numbers raise errors; values are not filled automatically. The interfaces are:
| Function | Input | Output and boundary |
|---|---|---|
adf_test |
One complete monthly series; regression deterministic terms and optional lag specification |
ADF statistic, approximate p-value, lags used, sample size, and corresponding critical values |
engle_granger_test |
Two same-month aligned series with at least 24 observations; optional trend and lag specifications | Engle–Granger statistic, dedicated p-value, and critical values |
| Common-trend, noncointegrated simulation | Length n and seed |
Shared random trend plus two independent random walks |
simulate_cointegrated_pair |
seed, a finite nonzero real beta, and $ |
\phi |
fit_var_forecast |
Training panel training, fixed lag lags, and forecast horizon steps |
Recursive forecasts indexed by future months; researchers must still verify stationarity |
granger_test |
Named, same-month aligned caused and causing series; maximum lag max_lag |
Joint F statistic and p-value with direction stated explicitly |
screen_cointegration_pairs |
Multicolumn level table levels and training cutoff month training_end |
Engle–Granger p-values and BH-adjusted p-values (often called q-values) for all pairs before the cutoff; an exploratory FDR adjustment that does not read post-cutoff values to estimate results |
total_return_index_proxy |
Monthly simple returns in decimal form returns |
Educational total-return index (TR index) compounded from 100 |
Reproduce the experiments, figures, and sample statistics with:
.venv/bin/python code/ch17_time_series_ii.py
.venv/bin/python -m pytest tests/test_ch17_cointegration.py -q
The script fixes the two simulation seeds at 20261017 and 20261018; seeds are not selected based on returns or p-values. The Engle–Granger wrapper explicitly calls statsmodels 0.15.0 coint; it does not assemble incorrect critical values from the ordinary ADF wrapper. Perfectly or nearly collinear inputs are rejected. For trend="n", if statsmodels returns NaN critical values, the interface preserves the missing values while separately checking that the test statistic and p-value are finite. All empirical forecasts and screens use only the training segment. Monthly data are indexed by month; a month is not treated as a fixed number of seconds. The Notebook calls the core module instead of duplicating the statistical implementation.
10. Visualization
Figure 17-1: Simulated comparison of a common random trend and a cointegrated pair. The two columns show the noncointegrated common-trend construction with seed 20261017 and the cointegrated construction with seed 20261018 and
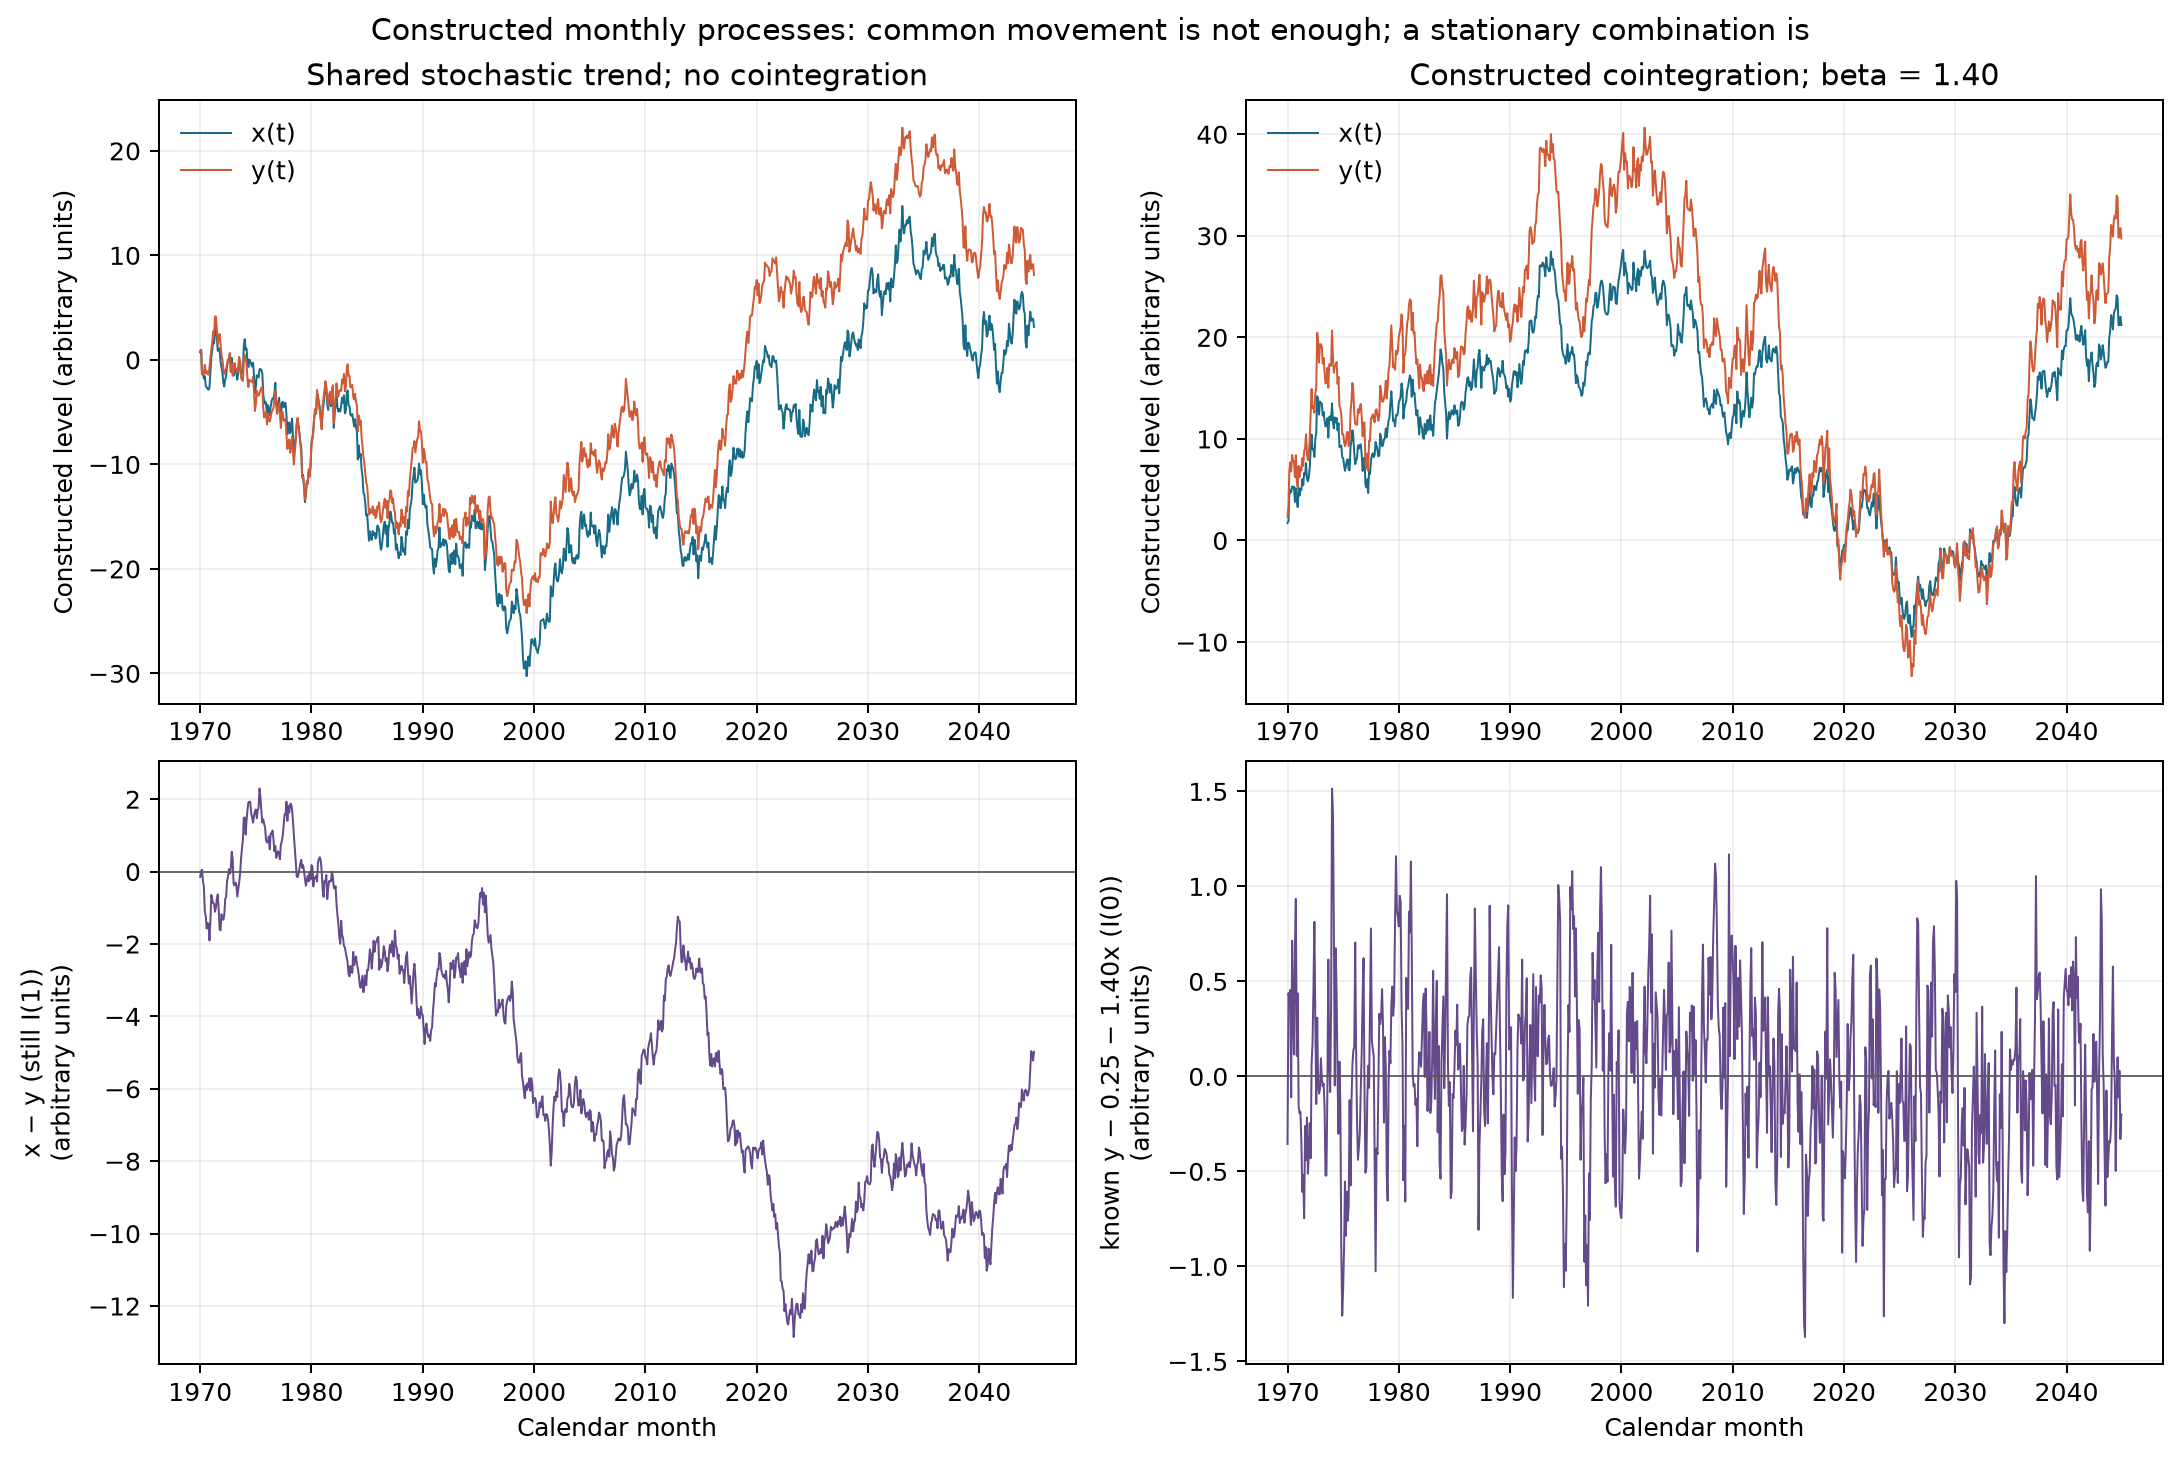
Figure 17-2: Cumulative-index proxy compounded from monthly returns for 10 French industries. The horizontal axis is the calendar month of the return observation. The vertical axis is logarithmic, after compounding the 10 industries' published monthly returns as
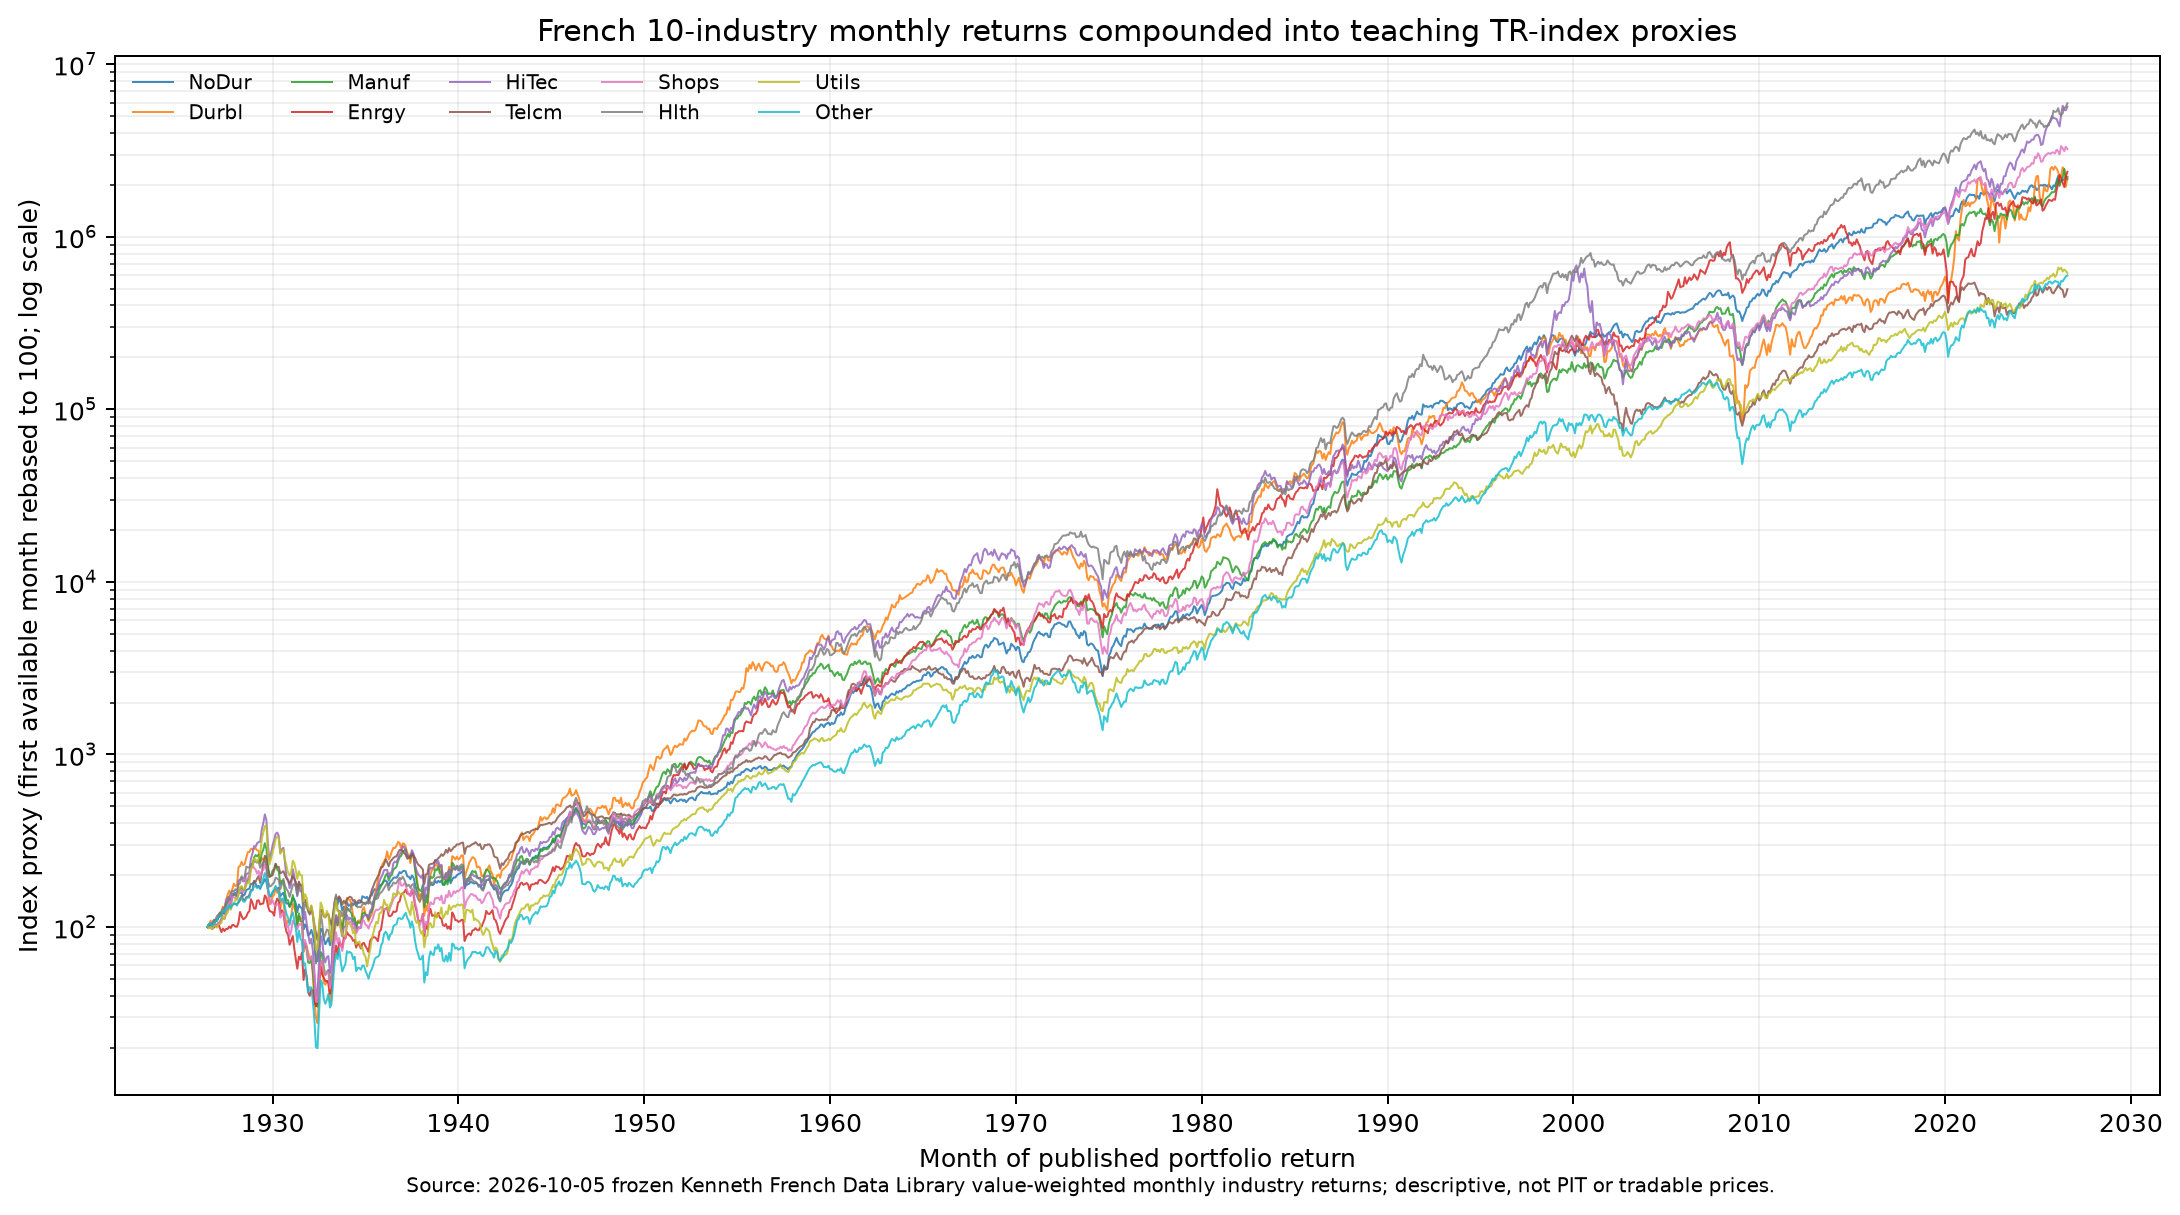
Both PNGs were generated by running code/ch17_time_series_ii.py. The code reads the local French CSV with its fixed hash and validates the legend, periods, and data range. They are not hand-drawn illustrations.
11. Real Market Example
This chapter uses the current cache of the Kenneth R. French Data Library's 10 Industry Portfolios: a ZIP downloaded on 2026-10-05, using the monthly block labeled Average Value Weighted Returns -- Monthly, with source percentages divided by 100. The source ZIP SHA-256 is ebd937a4b995d821867aeb956a96f09a666386f38fa82516b7d1767ee4a49ae5; the processed CSV SHA-256 is 3b097d810c295d64eedfa1ece7067ff2a0707f5ca90e33935df9949251f70950. The cache contains 1,202 months, 1926-07 through 2026-08. See source_notes.md and the data manifest for source-conversion details. Publicly downloadable does not mean unrestricted redistribution is licensed.
Compound each industry's published decimal simple returns into an educational TR Index proxy. During the 1926-07 through 2000-12 training interval, run a constant-term Engle–Granger test on all
These 10 columns are industry-portfolio returns, not 10 individual stocks. The cumulative values are index proxies constructed for this chapter's modeling, not executable adjusted prices for an actual fund and not point-in-time (PIT) data. The current release covers through 2026-08 and cannot reconstruct the version investors actually saw in each month since 1926. This chapter does not claim historical signal validity or report a strategy Sharpe ratio or return.
12. Common Mistakes
Mistake 1: The level correlation is 0.95, so the two series can be paired. A common stochastic trend can produce high correlation; test whether a linear combination is stationary. The output below is about 0.9552 and 0.457541; correlation is not a cointegration test.
from quant_course.cointegration import simulate_noncointegrated_common_trend, engle_granger_test
pair = simulate_noncointegrated_common_trend(n=900, seed=20261017)
test = engle_granger_test(pair["x"], pair["y"])
print(pair["x"].corr(pair["y"]), test.pvalue)
Mistake 2: Run ordinary ADF on first-stage OLS residuals and declare cointegration from the ordinary p-value. The residuals were estimated using the same I(1) data, so their null distribution differs. In the fixed simulation, ordinary ADF gives coint.
import numpy as np
import statsmodels.api as sm
from statsmodels.tsa.stattools import adfuller
from quant_course.cointegration import simulate_noncointegrated_common_trend, engle_granger_test
pair = simulate_noncointegrated_common_trend(n=900, seed=20261017)
design = sm.add_constant(pair["y"].to_numpy())
residual = pair["x"].to_numpy() - design @ sm.OLS(pair["x"].to_numpy(), design).fit().params
ordinary = adfuller(residual, regression="c", autolag="AIC", result_object=True)
correct = engle_granger_test(pair["x"], pair["y"])
print(ordinary.pvalue, correct.pvalue)  # approx. 0.23056 and 0.45754
Mistake 3: Granger significance means x structurally causes y. Reversing the column order asks a different predictive question. The result concerns only incremental predictive information for the specified sample and lags. The function makes the direction explicit and checks it against a known generating direction:
import numpy as np
import pandas as pd
from quant_course.cointegration import granger_test
rng = np.random.default_rng(23)
x = rng.normal(size=1000)
y = np.zeros(1000)
for t in range(1, len(y)):
    y[t] = 0.75 * x[t - 1] + rng.normal(scale=0.5)
index = pd.period_range("1950-01", periods=len(y), freq="M", name="month")
x_series = pd.Series(x, index=index, name="x")
y_series = pd.Series(y, index=index, name="y")
print(granger_test(caused=y_series, causing=x_series, max_lag=1).pvalue)
print(granger_test(caused=x_series, causing=y_series, max_lag=1).pvalue)
Mistake 4: Estimate the relationship on the full sample, then treat old z-scores as real-time signals. Future observations change the estimated intercept and slope. Split first and estimate using only the training period. This chapter's screen_cointegration_pairs accepts only the training_end prefix; a test changes future observations and confirms that screening results remain unchanged. Real orders also require recording data availability time.
import numpy as np
import pandas as pd
from quant_course.cointegration import simulate_cointegrated_pair
pair = simulate_cointegrated_pair(n=900, seed=20261018)
train = pair.loc[:pd.Period("2000-12", freq="M")]
design = np.column_stack([np.ones(len(train)), train["x"]])
alpha_hat, beta_hat = np.linalg.lstsq(design, train["y"], rcond=None)[0]
spread_train = train["y"] - alpha_hat - beta_hat * train["x"]
print(len(train), alpha_hat, beta_hat, spread_train.std(ddof=1))
Mistake 5: Assume adjacent rows remain one month apart after dropna(). Removing a missing month makes a multi-month difference look like a one-month change. The example shows the core interface rejecting this compressed index. Trace the source or specify a missing-data model; do not fill values inside the test function.
import numpy as np
import pandas as pd
from quant_course.cointegration import validate_monthly_frame
index = pd.period_range("2000-01", periods=4, freq="M", name="month")
series = pd.Series([0.01, np.nan, 0.02, 0.03], index=index, name="return")
try:
    validate_monthly_frame(series.dropna().to_frame())
except ValueError as error:
    print(type(error).__name__, error)
13. Quant Research Application
A credible pairs study should produce an auditable chain in at least the following order.
- State the hypothesis and falsification conditions. For example: “Two preselected assets are each I(1) in the specified regime, their log spread is stationary across multiple training and validation windows, and signal returns cover all costs.” Possible counterevidence includes different integration orders, failure to reject a unit root in the residual, relationship drift after a regime change, no out-of-sample mean reversion, or no advantage over a naive benchmark after costs.
- Freeze the data and clock. Save source-file hashes, units, corporate actions, price/return definitions, and
available_at. The industry cache in this chapter supports description of the current version of monthly portfolio returns only; it cannot give historical strategy signals PIT timestamps. - Split by time. Within the training interval, separately check both series' orders, specify deterministic terms, estimate long-run coefficients, test the specially calibrated Engle–Granger statistic, and account for multiple testing across families such as all 45 pairs. If screening pairs, pre-specify the candidate set and correction method; do not switch objects after seeing the validation period.
- Freeze signals and positions. Within training, fix
, spread-normalization parameters, entry/exit/stop rules, refit frequency, and each leg's dollar notional or risk budget. The cointegration regression's is not a risk-neutral weight; define each leg's target volatility, total gross exposure, and single-leg limit. - Align each leg's return interval. If a signal becomes available after month t closes, do not book the full month-t return for that signal. Set the first executable time after the close, and measure both legs' next holding-period returns over the same execution interval. Monthly French published returns do not recover this execution interval, so this chapter does not calculate backtest P&L.
- Deduct each leg's costs and compare benchmarks. Record commissions on both sides, spreads and impact, borrow availability and fees, financing, rebalancing turnover, halts/delistings, dividends, and taxes; compare with no-trade and naive hold/hedge benchmarks. Strategy validation also needs rolling or expanding windows, the available training prefix and next-period target at each step, uncertainty intervals, and crisis stress tests.
- Audit stability and failure. Check residual ACF and structural breaks, drift in
within windows, industry-definition changes, spread tails during crises, and borrow recalls. For multiple pairs selected in training, adjusted p-values do not replace independent out-of-sample validation.
This is a research design, not a record that Project 5 is complete. This chapter has no timestamped data, execution prices, borrow records, or NAV series; it cannot claim that a pairs strategy passed out-of-sample and cost tests.
Project 5: Connecting Statistical Training Outputs to the Execution Interface
The current accepted entry point for Project 5 is projects/project05/ACCEPTED_VERSION.md, and its primary specification is preregistration v2. Its acceptance covers implementation and constructed teaching validation; real-price empirical work remains blocked. Training outputs should distinguish the long-run regression intercept and slope, Engle–Granger screening results, training-spread mean and standard deviation, and subsequent execution rules. Apply these frozen outputs at each later time point; do not renormalize using the entire future spread. If the training window changes, generate the next relationship at the pre-specified refit time rather than replacing historical fits with a future estimate.
The two chapters have distinct interface responsibilities: Chapter 16 explains the time index, effective observation count, and conditional forecast; Chapter 17 explains relationship screening and the position being held. Project 5 then calculates results using its daily trading clock, cost model, and episode definition. Passing Engle–Granger and having
14. Chapter Summary
First use an ADF test with the appropriate deterministic terms to ask whether the series rejects a unit root, then consider whether several I(1) variables have a stationary linear combination. Ordinary ADF and Engle–Granger tests on estimated residuals have different null distributions; the latter requires cointegration-specific critical values. A VAR links multiple variables through lags to form conditional forecasts. A Granger joint test concerns only incremental predictive power within the specified information set. Cointegration, prediction, and structural causality answer different questions; none alone establishes that trading is feasible.
For a pairs application, the key transition is from an in-sample long-run error to a real-time executable rule: estimate coefficients using past data only, trade only after the signal is available, define a common return interval for both legs, and include risk and costs in validation. Simulations help readers understand the mechanisms. The current French industry cache helps check compounding and screening counts for published returns, but does not support historical real-time trading conclusions.
15. Exercises
Attempt the exercises independently before reading the answers and derivations in Section 18.
- 17-E01 (Concept): Two random walks have a sample correlation of 0.97. Is that enough to conclude they are cointegrated? What tests or conditions are still needed?
- 17-E02 (Unit root): If
in the ADF regression, can you reject a unit root based on its sign alone? Explain which statistic and specification are needed. - 17-E03 (Trend): Distinguish the persistence of shocks in
( ) from that in . - 17-E04 (Engle–Granger critical values): Why is it wrong to use ordinary
adfullercritical values on first-stage OLS residuals? - 17-E05 (Causality language): What does a significant result from
grangercausalitytests([y,x])test? Which stronger claim does it not support? - 17-E06 (Model selection): What is the problem with running ADF under all three specifications
c,ct, andctt, then reporting only the smallest p-value? - 17-E07 (Multiple comparisons): If 45 pairs each receive a 5% test, why are 22 nominally significant results not 22 verified long-run relationships?
- 17-E08 (Timing): A month-end t signal uses the full return for month t. What is wrong with calculating that signal's P&L from the same month's full return?
16. Programming Exercises
- 17-P01 (Simulation and testing): With fixed seeds, generate 900 months of a noncointegrated common-trend sample and a cointegrated sample. Report level correlations and the p-values from
engle_granger_test. Acceptance criteria: the same seed reproduces the same result; the first sample has correlation above 0.9 and does not reject the no-cointegration null at 5%; the second rejects it at 1%. Label the results as simulations. - 17-P02 (VAR time boundary): Construct a stationary bivariate monthly series. Fit a VAR(1) using only the first 80 months and forecast two months. After replacing the final 20 months with arbitrarily large values, the model input and forecasts based on the first 80 months must remain unchanged. State the output-column order, forecast months, and units.
- 17-P03 (Multiple-pair screening): Load the French 10-industry cache and compound 10 TRI proxies. Run Engle–Granger tests for all 45 pairs using only data through 2000-12; report p and BH q values. Add a constant to all post-cutoff observations and confirm that the training results do not change. Do not select pairs based on backtest returns.
- 17-P04 (Granger direction): Generate white-noise
and , then test and separately. Check the column order and interpretation; do not write a structural-causality conclusion.
17. Challenge Problems
- 17-C01 (Multiple testing and selection bias): Explain how choosing the smallest-p-value relationship among the 45 pairs from 10 series distorts significance. Propose a reproducible validation plan for each rolling training window that does not revisit the selected pair out of sample. Additional prerequisites: multiple comparisons and time-series cross-validation. 10 points: record all 45 pairs (2); select within training only (2); define a correction, permutation, or testing family (2); use an independent later window (2); state falsification conditions (2).
- 17-C02 (Error correction): Starting from the cointegration error
between two I(1) series, write an equation with lagged differences and explain its adjustment coefficient. Describe the long-run information lost in an ordinary differenced VAR and retained in a VECM, and how structural change can invalidate the error-correction term. Additional prerequisites: linear regression and VAR. 10 points: write lagged differences and an error term (3); explain the adjustment direction (2); distinguish long-run from short-run terms (2); give a structural-change example (2); state that this chapter does not estimate the model (1).
Additional Exercises (Independent Numbering)
- 17-N01 (Mechanism and hand calculation; §§3.1, 6.2): The common random walk has innovation variance 9, and each independent trend has innovation variance 0.25. Find the same-
correlation between the two levels and the variance of ; show that no can eliminate all trends. With a fixed initial level of 100 and innovations 2, −1, and 3, how do the levels change if the first shock is increased by 1? - 17-N02 (Test diagnosis; §6.3): Explain which test interpretation to use for a pre-specified combination, same-sample OLS residuals, and new-window residuals using frozen training coefficients. Why does an ADF non-rejection in a short window with
fail to prove a unit root? State when deterministic terms and lags should be selected. - 17-N03 (Two-leg ledger and interpretation; §6.6): Given
and A/B execution prices of 20/50 and exit prices of 20.6/50.5, find share counts, gross exposure, net notional, and price P&L. Charge 10 basis points on each leg's actual execution notional at entry and exit, then find net P&L (no dividends, borrow, or financing). If , what direction does a long spread take? If and shares are rounded toward zero, what is the actual hedge ratio? Explain what it means that Project 5 excludes negative beta.
18. Solutions / Solution Hints
Exercises
- 17-E01: No. A common stochastic trend can produce high correlation without a stationary linear combination. First assess whether both series are I(1) under suitable specifications, then use a cointegration-specific procedure such as Engle–Granger to test the combination. Sample correlation provides neither critical values nor evidence that the relationship will remain stable.
- 17-E02: No. The statistic is usually an ADF t-type statistic for
, with a nonstandard finite-sample Dickey–Fuller reference distribution. You also need the deterministic terms ( n/c/ct/ctt), lag selection, and matching critical value. A negative slope alone is insufficient. - 17-E03: In the first equation, under this chapter's definition
supplies only weak-stationarity and short-memory properties; those moment conditions alone do not imply a time-invariant full distribution or a vanishing response to one shock. With the additional assumption , a unit innovation changes the deviation by at horizon , so its effect decays while the trend is not permanently rewritten. The second equation contains a unit root: a shock at time remains with coefficient 1 in every later level, and variance grows with under independent, identically distributed innovations with finite variance. In the two equations, 0.4 is respectively a deterministic slope and a per-period drift. The claim that the first equation's shocks are temporary depends on the additional stable causal assumption; it does not follow automatically from the definition of weak stationarity. - 17-E04: The first stage estimates the long-run coefficient from the same nonstationary levels, minimizing the residual sum of squares. Under the no-cointegration null, that coefficient is not a stable true long-run parameter; the unit-root statistic for the estimated residual has a different null distribution from a univariate ADF test on a series specified in advance. Use the dedicated critical values returned by
coint. - 17-E05: statsmodels treats the second column,
, as the causing variable and the first column, , as the dependent series. It jointly tests whether the specified lag coefficients of in the equation are zero. Rejection means incremental linear predictive information for the specified sample, lags, and controls; it does not show that intervening on would cause to change. - 17-E06: Repeatedly selecting the smallest p-value implicitly includes specification search as multiple testing, so the nominal p-value no longer has its original meaning. Choose deterministic terms in advance based on assumptions about the data-generating process and report sensitivity; do not report only the most significant specification.
- 17-E07: The 45 tests can generate false positives, and the tests are dependent because they share industry series. The 22 nominally significant results describe only this exploratory family of tests. BH adjusts for FDR, and its theoretical guarantee requires independence or suitable positive dependence such as PRDS. That dependence condition has not been verified here, so 15 BH q-values below 0.05 are adjusted results, not evidence that FDR control is guaranteed; BH is not FWER control. Independent later-window testing is also needed. No adjustment guarantees relationship stability or tradability.
- 17-E08: The signal exists only once that month's return is fully formed and available. Booking P&L over the same month's start-to-end interval uses movement that occurred before the signal existed, reversing the time order. Specify the next executable time and calculate both legs' returns over the same interval after execution. Monthly portfolio files do not provide that finer-grained data.
Programming Exercises
- 17-P01: Run the chapter's core interfaces directly:
from quant_course.cointegration import (
    engle_granger_test, simulate_cointegrated_pair,
    simulate_noncointegrated_common_trend,
)
noncointegrated = simulate_noncointegrated_common_trend(n=900, seed=20261017)
cointegrated = simulate_cointegrated_pair(n=900, seed=20261018)
a = engle_granger_test(noncointegrated["x"], noncointegrated["y"])
b = engle_granger_test(cointegrated["y"], cointegrated["x"])
assert noncointegrated["x"].corr(noncointegrated["y"]) > .9
assert a.pvalue > .05 and b.pvalue < .01
print(a.pvalue, b.pvalue)  # approx. 0.457541 and 8.69312e-26
- 17-P02: The following code runs independently. First generate a stationary bivariate VAR(1), passing only the first 80 months into the fit and forecast. Then replace the final 20 months in the original panel with large values and recompute using the same training prefix. Both forecasts must be identical, begin in the month after the training cutoff, and retain the same column order.
import numpy as np
import pandas as pd
from pandas.testing import assert_frame_equal
from quant_course.cointegration import fit_var_forecast

rng = np.random.default_rng(29)
values = np.zeros((100, 2))
for t in range(1, 100):
    values[t] = np.array([0.25, -0.10]) + np.array(
        [[0.35, 0.12], [0.05, 0.30]]
    ) @ values[t - 1] + rng.normal(0.0, 0.1, size=2)
index = pd.period_range("2000-01", periods=100, freq="M", name="month")
panel = pd.DataFrame(values, index=index, columns=["A", "B"])
training = panel.iloc[:80].copy()
forecast = fit_var_forecast(training, lags=1, steps=2)

changed = panel.copy()
changed.iloc[80:] += 500.0
forecast_again = fit_var_forecast(changed.iloc[:80], lags=1, steps=2)
assert_frame_equal(forecast, forecast_again)
assert forecast.index.tolist() == [training.index[-1] + 1, training.index[-1] + 2]
assert forecast.columns.tolist() == ["A", "B"]
print(forecast)
- 17-P03: The reference implementation is located in
code/ch17_time_series_ii.py, inmain(): verify the frozen CSV hash; compound cached monthly returns that have already been divided by 100; set the training cutoff to 2000-12; loop over all 45 unordered pairs; calculate BH-adjusted p-values; and print every pair's unadjusted and BH-adjusted values. The corescreen_cointegration_pairsfunction uses only thetraining_endprefix. A test adds 10,000 to all post-cutoff data and confirms that every result field remains the same. The reproduced counts are 22/45 nominally significant and 15/45 with BH-adjusted p < 0.05. FDR-control conditions for this family of tests on shared series have not been verified; the results do not imply 15 tradable relationships. - 17-P04: The following code runs independently. The process makes
white noise and sets . It tests each predictive direction on month-aligned data and asserts strong significance in the known direction, but not the reverse. Rejecting the null means incremental predictive information under the given model and sample; it is not a structural-causality conclusion.
import numpy as np
import pandas as pd
from quant_course.cointegration import granger_test

rng = np.random.default_rng(23)
n = 1000
x = rng.normal(size=n)
y = np.zeros(n)
for t in range(1, n):
    y[t] = 0.75 * x[t - 1] + rng.normal(scale=0.5)
index = pd.period_range("1950-01", periods=n, freq="M", name="month")
x_series = pd.Series(x, index=index, name="x")
y_series = pd.Series(y, index=index, name="y")

x_predicts_y = granger_test(caused=y_series, causing=x_series, max_lag=1)
y_predicts_x = granger_test(caused=x_series, causing=y_series, max_lag=1)
assert x_predicts_y.pvalue < 1e-8
assert y_predicts_x.pvalue > 0.05
print("x -> y p-value:", x_predicts_y.pvalue)
print("y -> x p-value:", y_predicts_x.pvalue)
Challenge Problems
-
17-C01, suggested argument: For each outer training window, first freeze the 10 series names, the set of 45 pairs, deterministic terms, ADF lag rule, and multiple-testing method (for example, apply BH to p-values in the training window and also report the full unadjusted distribution). Inner rolling time-series windows may compare candidates, but each outer test window evaluates only the single model selected before that window began. Do not reselect pairs or recalculate training coefficients in the outer period. When retraining for the next period, explicitly record the old and new objects. Retain failed relationships and report drift in relationship sign and half-life, out-of-sample spread ACF, each leg's post-cost returns, and confidence intervals. If a relationship exists only in one regime, one very short window, or before costs, the hypothesis is falsified. Award points according to the 5 rubric items.
-
17-C02, suggested form:
The parenthesized term is the previous period's long-run error. If
is above the long-run combination and , the adjustment term lowers next-period ; stationarity, sign, and parameter stability still require empirical confirmation. A differenced VAR retains short-run difference dynamics but loses the level error; a VECM puts the cointegration error back into the model. If a regime change means the old no longer describes equilibrium, the adjustment term can point in the wrong direction. The prompt asks for the model form and research boundary; the chapter's core code does not estimate a VECM. Award points according to the rubric.
Answers to the Additional Exercises
17-N01. The level correlation is
17-N02. For a pre-specified fixed combination, the univariate ADF reference distribution may be used under its assumptions; same-window OLS residuals require the Engle–Granger no-cointegration distribution. A new-window residual with frozen training coefficients is a stability diagnostic; training error remains, so ordinary ADF calibration is not automatically exact. With
17-N03.
19. Further Reading
- Must Know: Dickey & Fuller (1979), pp. 427–431: focus on §§1–2 to understand the estimator distribution under a unit-root null and the deterministic-term specification. The chapter's source notes record the pages actually read.
- Must Know: Engle & Granger (1987), pp. 251–255 and 260–269: read the definitions of cointegration and error correction, the two-step estimator, and the explanation that residual tests cannot use ordinary DF critical values.
- Must Know: MacKinnon (2010), §§1–3 and the 2010 Appendix: read how cointegration-test critical values are calibrated for regressor count, trend terms, and sample size.
- Must Know: Benjamini & Hochberg (1995), pp. 289–300: focus on the FDR definition and BH step-up procedure under independent tests. Benjamini & Yekutieli (2001), pp. 1165–1188, discuss the extension under positive regression dependence on a subset (PRDS); shared industry pairs must not be assumed to meet its conditions without evidence.
- Should Know: Granger (1969), §§4–5: read the predictive meaning of “causality” and the bivariate model, noting the author's limitations concerning omitted variables, sample frequency, and nonstationarity.
- Should Know: The official statsmodels 0.15.0
adfuller,coint, VAR, andgrangercausalitytestsdocumentation: check the code API and output direction. Software documentation describes implementation; it does not replace the original theory. - Advanced: Said & Dickey (1984), Biometrika 71(3), 599–607, on asymptotic unit-root testing when the ARMA order is unknown. For this chapter, only the OUP bibliographic record and abstract were checked; the full text was not read. See the source notes.
20. References
- Dickey, D. A., & Fuller, W. A. (1979). “Distribution of the Estimators for Autoregressive Time Series with a Unit Root.” Journal of the American Statistical Association, 74(366), 427–431. DOI. Supports the nonstandard distribution under the unit-root null in §6.1.
- Engle, R. F., & Granger, C. W. J. (1987). “Co-Integration and Error Correction: Representation, Estimation, and Testing.” Econometrica, 55(2), 251–276. Official article page and abstract. Supports the two-step estimation and cointegration-residual testing in §§5 and 6.3.
- Granger, C. W. J. (1969). “Investigating Causal Relations by Econometric Models and Cross-Spectral Methods.” Econometrica, 37(3), 424–438. DOI. Supports the predictive-causality definition and limitations in §§5 and 6.4.
- MacKinnon, J. G. (2010). “Critical Values for Cointegration Tests.” Queen's Economics Department Working Paper No. 1227. PDF. Supports the cointegration critical-value calibration in §6.3.
- Benjamini, Y., & Hochberg, Y. (1995). “Controlling the False Discovery Rate: A Practical and Powerful Approach to Multiple Testing.” Journal of the Royal Statistical Society: Series B, 57(1), 289–300. DOI. Introduces and discusses FDR; the BH procedure controls FDR under the independent-test assumption and is not a family-wise error-rate procedure.
- Benjamini, Y., & Yekutieli, D. (2001). “The Control of the False Discovery Rate in Multiple Testing under Dependency.” The Annals of Statistics, 29(4), 1165–1188. DOI. Discusses BH FDR control under positive regression dependence (PRDS); the fact that tests are correlated does not establish that its conditions hold.
- Official statsmodels 0.15.0 documentation: ADF, Engle–Granger
coint, VAR, and Granger test. Supports code behavior only. - Kenneth R. French Data Library. 10 Industry Portfolios. Supports the source and monthly data-block location for industry returns in §11; cache revision, hash, and use limits are documented in
source_notes.md.